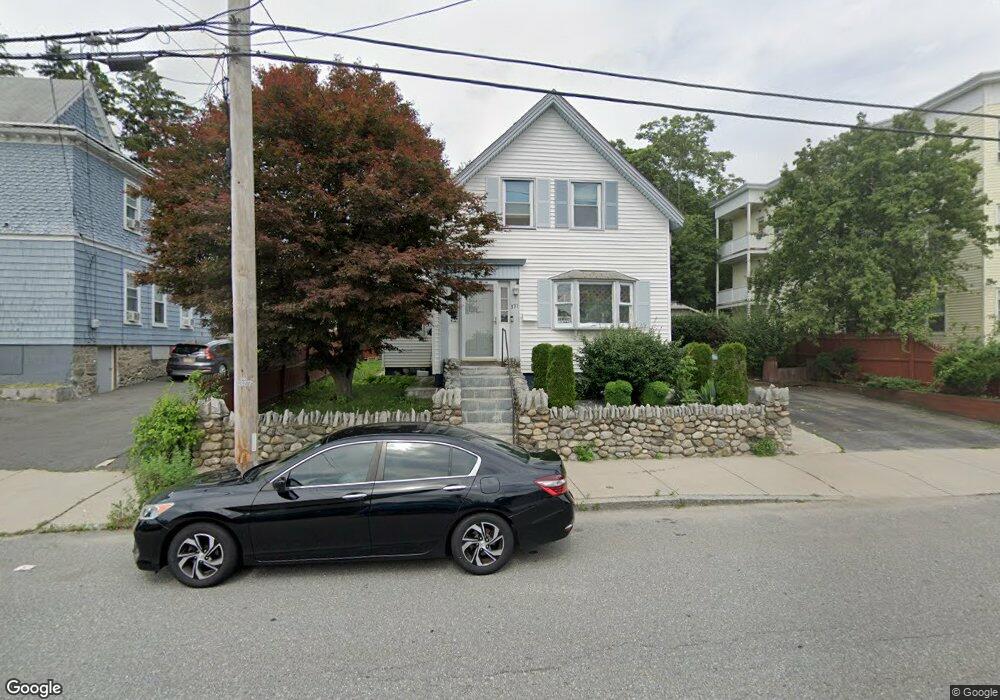
331 High St Lawrence, MA 01841
Prospect Hill-Back Bay NeighborhoodEstimated Value: $471,000 - $546,000
8
Beds
2
Baths
1,775
Sq Ft
$291/Sq Ft
Est. Value
About This Home
This home is located at 331 High St, Lawrence, MA 01841 and is currently estimated at $516,443, approximately $290 per square foot. 331 High St is a home located in Essex County with nearby schools including School For Exceptional Studies, Community Day Charter Public School - Gateway, and Esperanza Academy School of Hope.
Ownership History
Date
Name
Owned For
Owner Type
Purchase Details
Closed on
Aug 1, 2001
Sold by
Ross Salvador N and Ross Jenny C
Bought by
Rivera Christ A and Serna Lina M
Current Estimated Value
Home Financials for this Owner
Home Financials are based on the most recent Mortgage that was taken out on this home.
Original Mortgage
$155,868
Outstanding Balance
$60,758
Interest Rate
7.14%
Mortgage Type
Purchase Money Mortgage
Estimated Equity
$455,685
Create a Home Valuation Report for This Property
The Home Valuation Report is an in-depth analysis detailing your home's value as well as a comparison with similar homes in the area
Home Values in the Area
Average Home Value in this Area
Purchase History
| Date | Buyer | Sale Price | Title Company |
|---|---|---|---|
| Rivera Christ A | $157,100 | -- |
Source: Public Records
Mortgage History
| Date | Status | Borrower | Loan Amount |
|---|---|---|---|
| Open | Rivera Christ A | $155,868 | |
| Previous Owner | Rivera Christ A | $86,400 | |
| Previous Owner | Rivera Christ A | $75,000 |
Source: Public Records
Tax History
| Year | Tax Paid | Tax Assessment Tax Assessment Total Assessment is a certain percentage of the fair market value that is determined by local assessors to be the total taxable value of land and additions on the property. | Land | Improvement |
|---|---|---|---|---|
| 2025 | $3,594 | $408,400 | $129,900 | $278,500 |
| 2024 | $3,271 | $353,600 | $125,600 | $228,000 |
| 2023 | $3,333 | $328,100 | $108,300 | $219,800 |
| 2022 | $3,131 | $273,700 | $100,500 | $173,200 |
| 2021 | $3,033 | $247,200 | $100,500 | $146,700 |
| 2020 | $2,824 | $227,200 | $80,500 | $146,700 |
| 2019 | $2,952 | $215,800 | $83,300 | $132,500 |
| 2018 | $2,580 | $180,200 | $75,800 | $104,400 |
| 2017 | $2,523 | $164,500 | $75,000 | $89,500 |
| 2016 | $2,297 | $148,100 | $50,000 | $98,100 |
| 2015 | $2,239 | $148,100 | $50,000 | $98,100 |
Source: Public Records
Map
Nearby Homes
- 162 E Haverhill St
- 5 Kendrick St
- 109 Ferry St
- 192 Union St
- 39 Swan Ave
- 106 Leroy Ave
- 80-82 Haverhill St
- 89 Newbury St Unit 89B
- 14 Court St
- 264 E Haverhill St Unit 2
- 91 Summer St Unit 2
- 32 Josephine Ave
- 12 Annette St
- 2 Cherry St
- 18 Erhardt Terrace
- 25-27 Bicknell Ave
- 131A Lawrence St Unit 40
- 7 Erhardt Terrace
- 52 Howard St
- 27 Woodland Ct
- 329 High St
- 137 E Haverhill St
- 135 E Haverhill St
- 139 E Haverhill St
- 139 E Haverhill St Unit 139A
- 139 E Haverhill St Unit B
- 328 High St
- 325 High St
- 324 High St Unit 326
- 319 High St
- 319 High St Unit 3
- 338 High St
- 313 High St
- 133 E Haverhill St
- 18 Clarence Terrace
- 141 E Haverhill St
- 9 Prospect Ct
- 3 Kendall St
- 16 Prospect Ct
- 16 Prospect Ct Unit 2
Your Personal Tour Guide
Ask me questions while you tour the home.