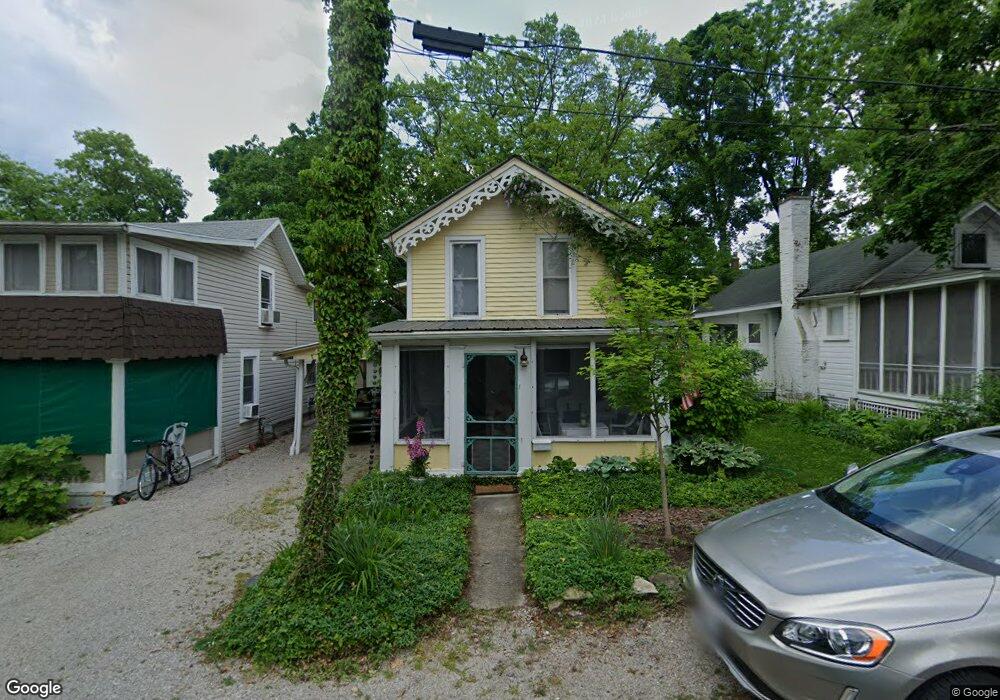
331 Jasmine Ave Lakeside Marblehead, OH 43440
Estimated Value: $453,309 - $792,000
3
Beds
1
Bath
1,381
Sq Ft
$449/Sq Ft
Est. Value
About This Home
This home is located at 331 Jasmine Ave, Lakeside Marblehead, OH 43440 and is currently estimated at $620,077, approximately $449 per square foot. 331 Jasmine Ave is a home located in Ottawa County with nearby schools including Danbury Middle School and Danbury High School.
Ownership History
Date
Name
Owned For
Owner Type
Purchase Details
Closed on
Mar 28, 2011
Sold by
Sowash Jonathan and Watt Kassandra
Bought by
Brollier Gordon and Brollier Virginia
Current Estimated Value
Home Financials for this Owner
Home Financials are based on the most recent Mortgage that was taken out on this home.
Original Mortgage
$80,000
Outstanding Balance
$4,366
Interest Rate
5.04%
Mortgage Type
New Conventional
Estimated Equity
$615,711
Purchase Details
Closed on
Jan 19, 2011
Sold by
Estate Of Pauline Hoff Sowash
Bought by
Sowash Jonathan and Sowash Bradley
Purchase Details
Closed on
Mar 3, 1993
Sold by
Sowash Rich and Sowash Pauline S
Bought by
Sowash Pauline J
Create a Home Valuation Report for This Property
The Home Valuation Report is an in-depth analysis detailing your home's value as well as a comparison with similar homes in the area
Home Values in the Area
Average Home Value in this Area
Purchase History
| Date | Buyer | Sale Price | Title Company |
|---|---|---|---|
| Brollier Gordon | -- | Attorney | |
| Sowash Jonathan | -- | Attorney | |
| Sowash Jonathan | -- | None Available | |
| Sowash Pauline J | -- | -- |
Source: Public Records
Mortgage History
| Date | Status | Borrower | Loan Amount |
|---|---|---|---|
| Open | Brollier Gordon | $80,000 |
Source: Public Records
Tax History Compared to Growth
Tax History
| Year | Tax Paid | Tax Assessment Tax Assessment Total Assessment is a certain percentage of the fair market value that is determined by local assessors to be the total taxable value of land and additions on the property. | Land | Improvement |
|---|---|---|---|---|
| 2024 | $5,161 | $151,407 | $101,301 | $50,106 |
| 2023 | $5,161 | $115,808 | $92,092 | $23,716 |
| 2022 | $3,998 | $115,808 | $92,092 | $23,716 |
| 2021 | $4,010 | $115,810 | $92,090 | $23,720 |
| 2020 | $3,385 | $92,520 | $70,840 | $21,680 |
| 2019 | $3,132 | $92,520 | $70,840 | $21,680 |
| 2018 | $3,289 | $92,520 | $70,840 | $21,680 |
| 2017 | $3,020 | $83,720 | $65,880 | $17,840 |
| 2016 | $2,992 | $83,720 | $65,880 | $17,840 |
| 2015 | $3,006 | $83,720 | $65,880 | $17,840 |
| 2014 | $1,512 | $88,680 | $70,840 | $17,840 |
| 2013 | $1,512 | $88,680 | $70,840 | $17,840 |
Source: Public Records
Map
Nearby Homes