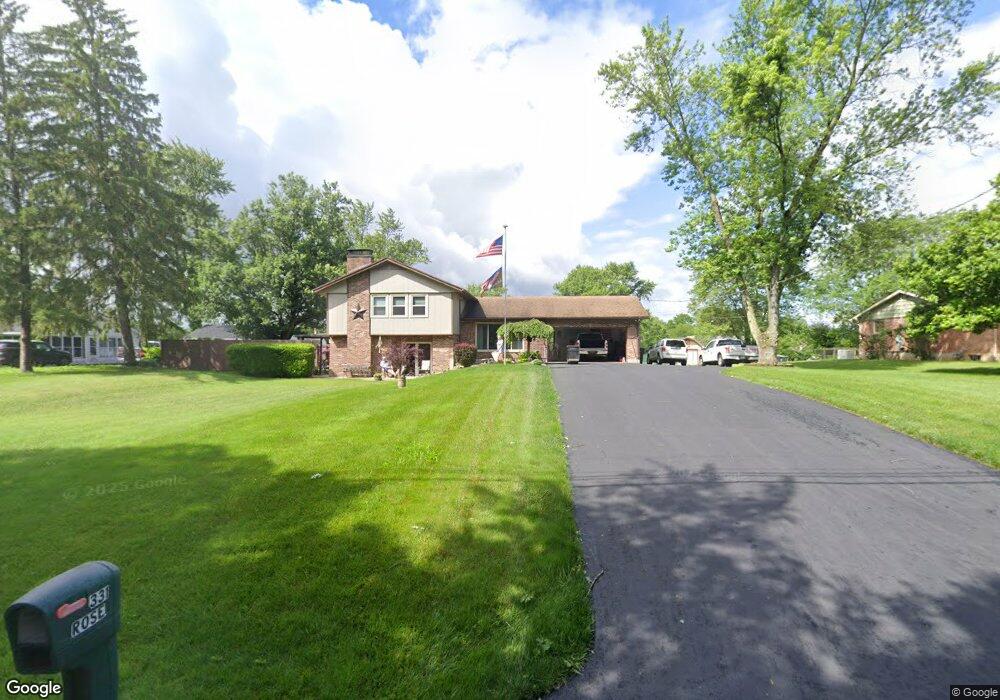
331 Kimmel Rd Clayton, OH 45315
Estimated Value: $230,048 - $296,000
4
Beds
2
Baths
1,076
Sq Ft
$244/Sq Ft
Est. Value
About This Home
This home is located at 331 Kimmel Rd, Clayton, OH 45315 and is currently estimated at $262,012, approximately $243 per square foot. 331 Kimmel Rd is a home located in Montgomery County with nearby schools including Northmoor Elementary School, Northmont High School, and Salem Christian Academy.
Ownership History
Date
Name
Owned For
Owner Type
Purchase Details
Closed on
Oct 17, 2019
Sold by
Rose Earnest Randy
Bought by
Rose Earnest Randy and Rose Darlene L
Current Estimated Value
Purchase Details
Closed on
Nov 30, 2005
Sold by
Rose Pamela J and Hale Pamela J
Bought by
Rose Earnest Randy
Home Financials for this Owner
Home Financials are based on the most recent Mortgage that was taken out on this home.
Original Mortgage
$110,000
Outstanding Balance
$61,801
Interest Rate
6.36%
Mortgage Type
Fannie Mae Freddie Mac
Estimated Equity
$200,211
Purchase Details
Closed on
Sep 24, 2002
Sold by
Leff Sanford and Leff Marsha L
Bought by
Rose Pamela J and Hale Pamela J
Home Financials for this Owner
Home Financials are based on the most recent Mortgage that was taken out on this home.
Original Mortgage
$89,925
Interest Rate
6.32%
Create a Home Valuation Report for This Property
The Home Valuation Report is an in-depth analysis detailing your home's value as well as a comparison with similar homes in the area
Home Values in the Area
Average Home Value in this Area
Purchase History
| Date | Buyer | Sale Price | Title Company |
|---|---|---|---|
| Rose Earnest Randy | -- | None Available | |
| Rose Earnest Randy | $120,000 | Landmark Title Agency Inc | |
| Rose Pamela J | $119,000 | Sterling Land Title North Ll |
Source: Public Records
Mortgage History
| Date | Status | Borrower | Loan Amount |
|---|---|---|---|
| Open | Rose Earnest Randy | $110,000 | |
| Previous Owner | Rose Pamela J | $89,925 |
Source: Public Records
Tax History Compared to Growth
Tax History
| Year | Tax Paid | Tax Assessment Tax Assessment Total Assessment is a certain percentage of the fair market value that is determined by local assessors to be the total taxable value of land and additions on the property. | Land | Improvement |
|---|---|---|---|---|
| 2024 | $3,330 | $57,120 | $16,170 | $40,950 |
| 2023 | $3,330 | $57,120 | $16,170 | $40,950 |
| 2022 | $3,088 | $40,520 | $11,470 | $29,050 |
| 2021 | $3,096 | $40,520 | $11,470 | $29,050 |
| 2020 | $3,091 | $40,520 | $11,470 | $29,050 |
| 2019 | $3,438 | $40,670 | $13,180 | $27,490 |
| 2018 | $3,447 | $40,670 | $13,180 | $27,490 |
| 2017 | $3,424 | $40,670 | $13,180 | $27,490 |
| 2016 | $2,839 | $32,920 | $11,470 | $21,450 |
| 2015 | $2,611 | $32,920 | $11,470 | $21,450 |
| 2014 | $2,611 | $32,920 | $11,470 | $21,450 |
| 2012 | -- | $37,660 | $11,470 | $26,190 |
Source: Public Records
Map
Nearby Homes
- 7939 Parsley Place
- 7415 Pleasant Plain Rd
- 7944 Parsley Place
- 8530 Talmadge Rd
- 6543 Brookville Salem Rd
- 7980 Parsley Place
- 5769 Dill Blvd
- 7706 Cilantro Way
- 7739 Cilantro Way
- 7742 Cilantro Way
- 7746 Cilantro Way
- 7750 Cilantro Way
- 7754 Cilantro Way
- 8611 Blue Teal Dr
- Holcombe Plan at Wenger Village
- Milford Plan at Wenger Village
- Bellamy Plan at Wenger Village
- Pendleton Plan at Wenger Village
- Newcastle Plan at Wenger Village
- Chatham Plan at Wenger Village