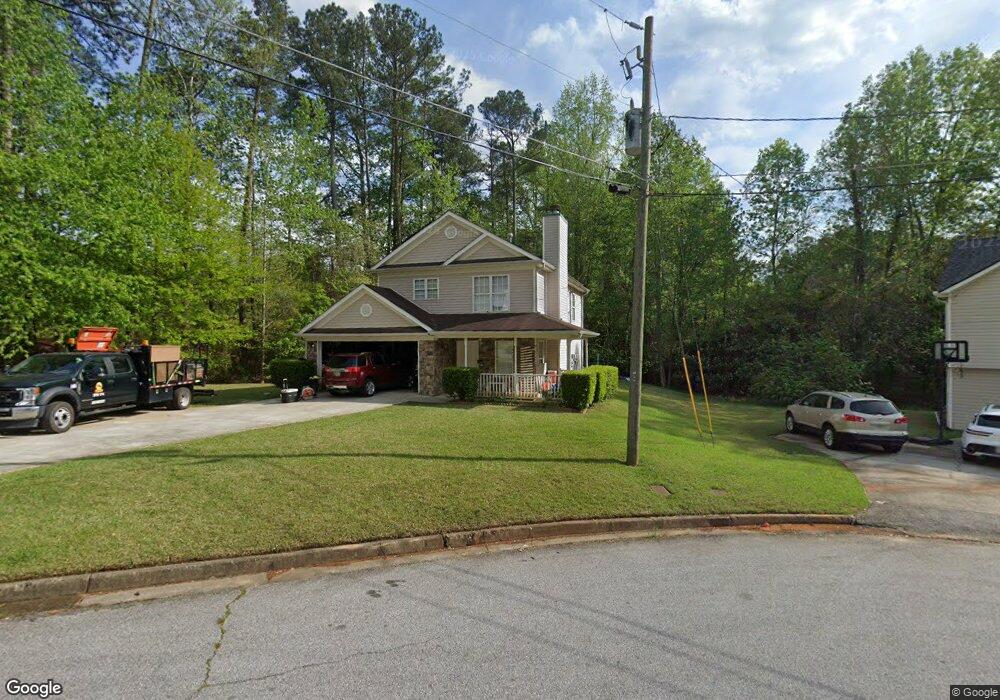
331 King Arthur Ct Jonesboro, GA 30236
Estimated Value: $221,000 - $288,000
3
Beds
3
Baths
1,564
Sq Ft
$156/Sq Ft
Est. Value
About This Home
This home is located at 331 King Arthur Ct, Jonesboro, GA 30236 and is currently estimated at $243,315, approximately $155 per square foot. 331 King Arthur Ct is a home located in Clayton County with nearby schools including Kilpatrick Elementary School, Sequoyah Middle School, and Charles R. Drew High School.
Ownership History
Date
Name
Owned For
Owner Type
Purchase Details
Closed on
Nov 16, 2010
Sold by
Federal Natl Mtg Assn Fnma
Bought by
Santacruz Jose A
Current Estimated Value
Purchase Details
Closed on
Jul 6, 2010
Sold by
Everhome Mtg Co
Bought by
Federal Natl Mtg Assn Fnma
Purchase Details
Closed on
Feb 3, 2005
Sold by
Huff Harriet
Bought by
Bryant Gail
Home Financials for this Owner
Home Financials are based on the most recent Mortgage that was taken out on this home.
Original Mortgage
$132,000
Interest Rate
5.6%
Mortgage Type
New Conventional
Purchase Details
Closed on
Nov 12, 2002
Sold by
Wright Ernest
Bought by
Walker Latanya T
Purchase Details
Closed on
Dec 7, 2001
Sold by
J & E Builders Inc
Bought by
Walker Latanya T
Home Financials for this Owner
Home Financials are based on the most recent Mortgage that was taken out on this home.
Original Mortgage
$122,058
Interest Rate
6.85%
Mortgage Type
New Conventional
Create a Home Valuation Report for This Property
The Home Valuation Report is an in-depth analysis detailing your home's value as well as a comparison with similar homes in the area
Home Values in the Area
Average Home Value in this Area
Purchase History
| Date | Buyer | Sale Price | Title Company |
|---|---|---|---|
| Santacruz Jose A | -- | -- | |
| Federal Natl Mtg Assn Fnma | -- | -- | |
| Everhome Mtg Co | $119,115 | -- | |
| Bryant Gail | $132,000 | -- | |
| Walker Latanya T | -- | -- | |
| Walker Latanya T | $124,000 | -- |
Source: Public Records
Mortgage History
| Date | Status | Borrower | Loan Amount |
|---|---|---|---|
| Previous Owner | Bryant Gail | $132,000 | |
| Previous Owner | Walker Latanya T | $122,058 |
Source: Public Records
Tax History Compared to Growth
Tax History
| Year | Tax Paid | Tax Assessment Tax Assessment Total Assessment is a certain percentage of the fair market value that is determined by local assessors to be the total taxable value of land and additions on the property. | Land | Improvement |
|---|---|---|---|---|
| 2025 | $3,281 | $94,640 | $6,400 | $88,240 |
| 2024 | $2,999 | $85,880 | $6,400 | $79,480 |
| 2023 | $3,065 | $84,880 | $6,400 | $78,480 |
| 2022 | $2,433 | $71,000 | $6,400 | $64,600 |
| 2021 | $1,718 | $6,400 | $6,400 | $46,096 |
| 2020 | $1,360 | $43,023 | $6,400 | $36,623 |
| 2019 | $1,112 | $36,424 | $3,200 | $33,224 |
| 2018 | $936 | $32,092 | $3,200 | $28,892 |
| 2017 | $621 | $24,310 | $3,200 | $21,110 |
| 2016 | $649 | $24,979 | $3,200 | $21,779 |
| 2015 | $639 | $0 | $0 | $0 |
| 2014 | $396 | $18,941 | $3,200 | $15,741 |
Source: Public Records
Map
Nearby Homes
- 7114 Lady Heidi Ct
- 7118 Lady Heidi Ct
- 367 Camelot Pkwy
- 285 Queen Helen Ln
- 446 Queen Aliese Ln
- 112 Rivercrest Dr
- 3938 Alderwoods Dr
- 213 Whipporwill Way
- 3942 Alderwoods Dr
- 3943 Alderwoods Dr
- 7428 Mockingbird Trail
- 7348 Mockingbird Trail
- 7390 Ovis Ln
- 439 River Rd
- 90 Jonathan Rd
- 200 Sunrise Cir
- 363 River Rd
- 680 Sherwood Dr
- 7017 Sun Valley Way
- 9404 Maple Dr Unit 292
- 323 King Arthur Ct
- 303 Sir Galahad Ct
- 324 King Arthur Ct Unit 4
- 332 King Arthur Ct Unit 4
- 297 Sir Galahad Ct
- 320 King Arthur Ct
- 317 King Arthur Ct
- 342 King Arthur Ct
- 316 King Arthur Ct
- 293 Sir Galahad Ct
- 292 Sir Galahad Ct Unit 3
- 352 King Arthur Ct
- 7126 Sir Galahad Way
- 7114 Sir Galahad Way
- 363 King Arthur Ct
- 364 King Arthur Ct
- 7110 Sir Galahad Way Unit 2
- 7130 Sir Galahad Way
- 7117 Sir Galahad Way
- 363 Lady Guinevere Way