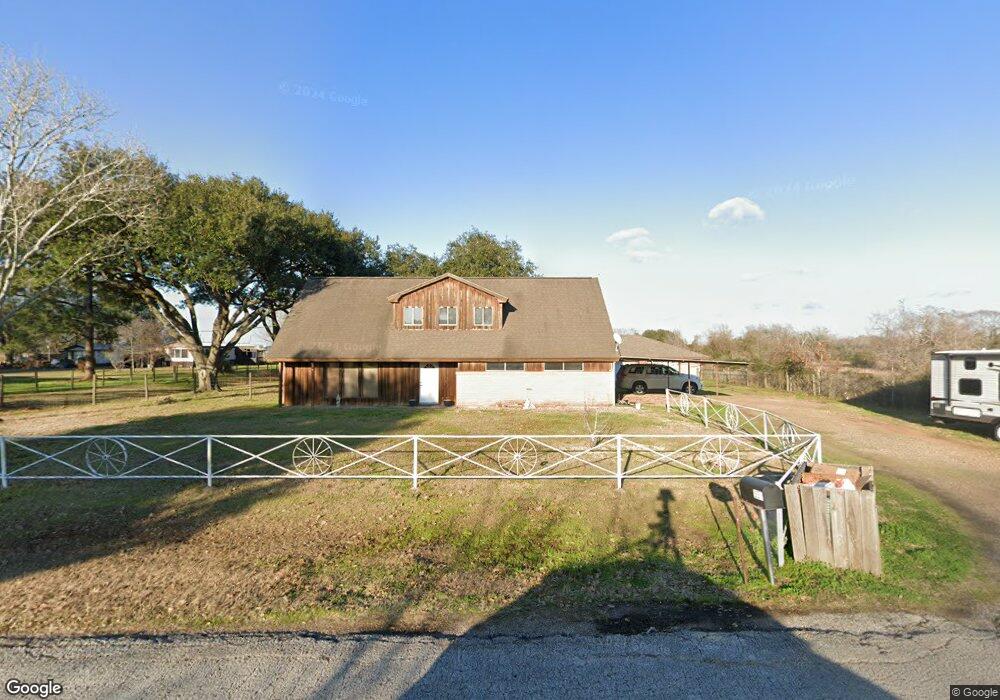
331 Leon Rd Rosenberg, TX 77471
Estimated Value: $315,864 - $380,000
4
Beds
2
Baths
2,240
Sq Ft
$158/Sq Ft
Est. Value
About This Home
This home is located at 331 Leon Rd, Rosenberg, TX 77471 and is currently estimated at $353,466, approximately $157 per square foot. 331 Leon Rd is a home located in Fort Bend County with nearby schools including Bowie Elementary School, George Junior High School, and B.F. Terry High School.
Ownership History
Date
Name
Owned For
Owner Type
Purchase Details
Closed on
May 25, 2017
Sold by
Matheaus Tuesday Blair and Sloan Robert Andrew
Bought by
Debaillon Jamie and Debaillon Christopher
Current Estimated Value
Home Financials for this Owner
Home Financials are based on the most recent Mortgage that was taken out on this home.
Original Mortgage
$193,500
Outstanding Balance
$100,648
Interest Rate
4.08%
Mortgage Type
New Conventional
Estimated Equity
$252,819
Purchase Details
Closed on
Jun 2, 2011
Sold by
Amonette John and Morgan Chera Miranda
Bought by
Matheaus Tuesday Blair and Sloan Robert Andrew
Home Financials for this Owner
Home Financials are based on the most recent Mortgage that was taken out on this home.
Original Mortgage
$128,458
Interest Rate
4.87%
Mortgage Type
FHA
Purchase Details
Closed on
Jun 7, 2008
Sold by
Amanette John and Amanette Cherry
Bought by
Debaillon Jamie and Debaillon Christopher
Create a Home Valuation Report for This Property
The Home Valuation Report is an in-depth analysis detailing your home's value as well as a comparison with similar homes in the area
Home Values in the Area
Average Home Value in this Area
Purchase History
| Date | Buyer | Sale Price | Title Company |
|---|---|---|---|
| Debaillon Jamie | -- | None Available | |
| Matheaus Tuesday Blair | -- | Startex Title Company Llc | |
| Debaillon Jamie | -- | -- |
Source: Public Records
Mortgage History
| Date | Status | Borrower | Loan Amount |
|---|---|---|---|
| Open | Debaillon Jamie | $193,500 | |
| Previous Owner | Matheaus Tuesday Blair | $128,458 |
Source: Public Records
Tax History
| Year | Tax Paid | Tax Assessment Tax Assessment Total Assessment is a certain percentage of the fair market value that is determined by local assessors to be the total taxable value of land and additions on the property. | Land | Improvement |
|---|---|---|---|---|
| 2025 | $1,466 | $181,415 | $138,492 | $120,117 |
| 2024 | $1,466 | $164,923 | $3,208 | $161,715 |
| 2023 | $1,250 | $149,930 | $0 | $157,963 |
| 2022 | $1,824 | $136,300 | $0 | $145,350 |
| 2021 | $2,224 | $123,910 | $24,280 | $99,630 |
| 2020 | $2,264 | $124,220 | $24,280 | $99,940 |
| 2019 | $2,387 | $122,170 | $24,280 | $97,890 |
| 2018 | $2,290 | $116,870 | $24,280 | $92,590 |
| 2017 | $2,112 | $107,510 | $24,280 | $83,230 |
| 2016 | $2,102 | $107,010 | $24,280 | $82,730 |
| 2015 | $1,674 | $107,580 | $24,280 | $83,300 |
| 2014 | $1,685 | $106,050 | $24,280 | $81,770 |
Source: Public Records
Map
Nearby Homes
- 7514 Dixon Rd
- 1106 Armadillo Rd
- 00 Texas 10 Spur
- 0 Texas 10 Spur
- 3210 Spanish Oak Ln
- 3406 Fresh Bluestream Ln
- 3422 Fresh Bluestream Ln
- 1607 Westland Ln
- 1611 Westland Ln
- 1615 Westland Ln
- 1622 Westland Ln
- 1626 Westland Ln
- 1618 Birch Wood Dr
- 1634 Westland Ln
- 1638 Westland Ln
- 3411 Silvery Bryum Dr
- 3407 Silvery Bryum Dr
- 00 Muegge Rd
- 3326 Hereford Dr
- 3330 Hereford Dr
- 305 Leon Rd
- 227 Leon Rd
- 328 Leon Rd
- 320 Leon Rd
- 316 Leon Rd
- 226 Leon Rd
- 207 Leon Rd
- 412 Cottonwood Church Rd Unit 5
- 412 Cottonwood Church Rd Unit 7
- 0000 Cottonwood Church Rd
- 218 Leon Rd
- 203 Leon Rd
- 421 Cottonwood Church Rd
- 116 Leon Rd
- 3227 Us Highway 59 South N
- 3227 Hwy 59 S
- 3227 N Us Highway 59 Fwy S
- 3227 US HIGHWAY 59 S N 3227 Hwy 59 Fwy S
- 3227 Highway 59 S
- 3238 Klosterhoff Rd
Your Personal Tour Guide
Ask me questions while you tour the home.