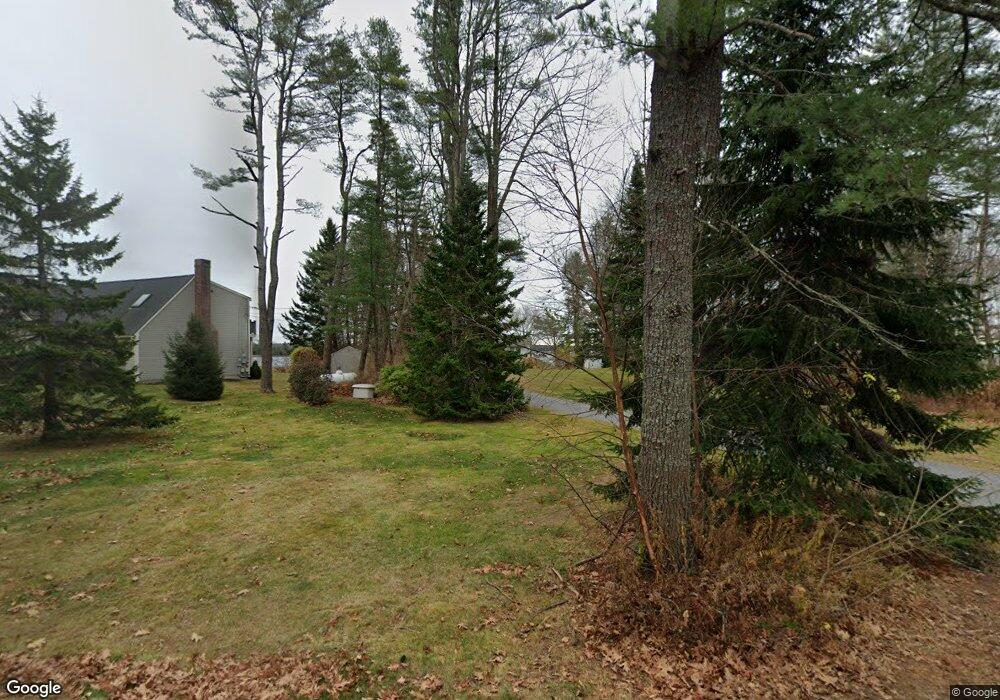
331 Lower Flying Point Rd Freeport, ME 04032
Estimated Value: $924,000 - $1,663,000
2
Beds
2
Baths
1,832
Sq Ft
$770/Sq Ft
Est. Value
About This Home
This home is located at 331 Lower Flying Point Rd, Freeport, ME 04032 and is currently estimated at $1,410,024, approximately $769 per square foot. 331 Lower Flying Point Rd is a home located in Cumberland County with nearby schools including Morse Street School, Mast Landing School, and Freeport Middle School.
Ownership History
Date
Name
Owned For
Owner Type
Purchase Details
Closed on
Apr 20, 2021
Sold by
Sansone John M and Jordan Barbara L
Bought by
Simpson Mackenzie and Simpson Mattie
Current Estimated Value
Home Financials for this Owner
Home Financials are based on the most recent Mortgage that was taken out on this home.
Original Mortgage
$720,000
Outstanding Balance
$644,410
Interest Rate
3%
Mortgage Type
Purchase Money Mortgage
Estimated Equity
$765,614
Purchase Details
Closed on
Mar 1, 2011
Sold by
Soule Margaret F and Soule Nelson S
Bought by
Sansone John M and Jordan Barbara L
Create a Home Valuation Report for This Property
The Home Valuation Report is an in-depth analysis detailing your home's value as well as a comparison with similar homes in the area
Home Values in the Area
Average Home Value in this Area
Purchase History
| Date | Buyer | Sale Price | Title Company |
|---|---|---|---|
| Simpson Mackenzie | -- | None Available | |
| Sansone John M | -- | -- |
Source: Public Records
Mortgage History
| Date | Status | Borrower | Loan Amount |
|---|---|---|---|
| Open | Simpson Mackenzie | $720,000 |
Source: Public Records
Tax History
| Year | Tax Paid | Tax Assessment Tax Assessment Total Assessment is a certain percentage of the fair market value that is determined by local assessors to be the total taxable value of land and additions on the property. | Land | Improvement |
|---|---|---|---|---|
| 2025 | $14,311 | $1,033,300 | $833,200 | $200,100 |
| 2024 | $13,266 | $993,700 | $793,600 | $200,100 |
| 2023 | $12,320 | $896,000 | $721,500 | $174,500 |
| 2022 | $10,790 | $790,500 | $644,200 | $146,300 |
| 2021 | $10,555 | $790,600 | $644,200 | $146,400 |
| 2020 | $10,241 | $731,500 | $596,500 | $135,000 |
| 2019 | $9,868 | $690,100 | $562,700 | $127,400 |
| 2018 | $9,582 | $636,700 | $518,700 | $118,000 |
| 2017 | $8,879 | $593,900 | $480,600 | $113,300 |
| 2016 | $8,425 | $533,200 | $428,100 | $105,100 |
| 2015 | $8,617 | $512,900 | $415,500 | $97,400 |
| 2014 | $8,104 | $512,900 | $415,500 | $97,400 |
| 2013 | $8,862 | $559,100 | $461,600 | $97,500 |
Source: Public Records
Map
Nearby Homes
- 58 Maquoit Dr
- 70 Maquoit Dr
- 83 Central Ave
- 46 Blackstone Club Rd
- 34 Newfield Rd
- 26 Harvest Ridge Rd Unit 24
- 20 Harvest Ridge Rd Unit 23
- 7 Shearwater Way
- 15 Linwood Rd Unit 15
- 5 Holbrook St
- 11 Orchard Hill Rd
- Map 80 Lot 18-0 White Island
- 67 Farmview Ln
- 212 Main St
- 39 Hunter Rd
- 15 Tinkers Way
- 1 Mallard Pond Rd
- 1450 Harpswell Neck Rd
- 31 Goose Ledge Rd
- Lot 2B Allen Point Rd
- 327 Lower Flying Point Rd
- 327 Lower Flying Point Rd
- 327 Lower Flying Point Rd Unit 2
- 339 Lower Flying Point Rd
- 8 Island View Ln
- 8 Blossom Ln
- 10 Blossom Ln
- 12 Blossom Ln
- 9 Blossom Ln
- 7 Blossom Ln
- 12 Island View Ln
- 23 Island View Ln
- 345 Lower Flying Point Rd
- 317 Lower Flying Point Rd
- 16 Island View Ln
- 351 Lower Flying Point Rd
- 14 Island View Ln
- 20 Island View Ln
- 17 Island View Ln
- 359 Lower Flying Point Rd
Your Personal Tour Guide
Ask me questions while you tour the home.