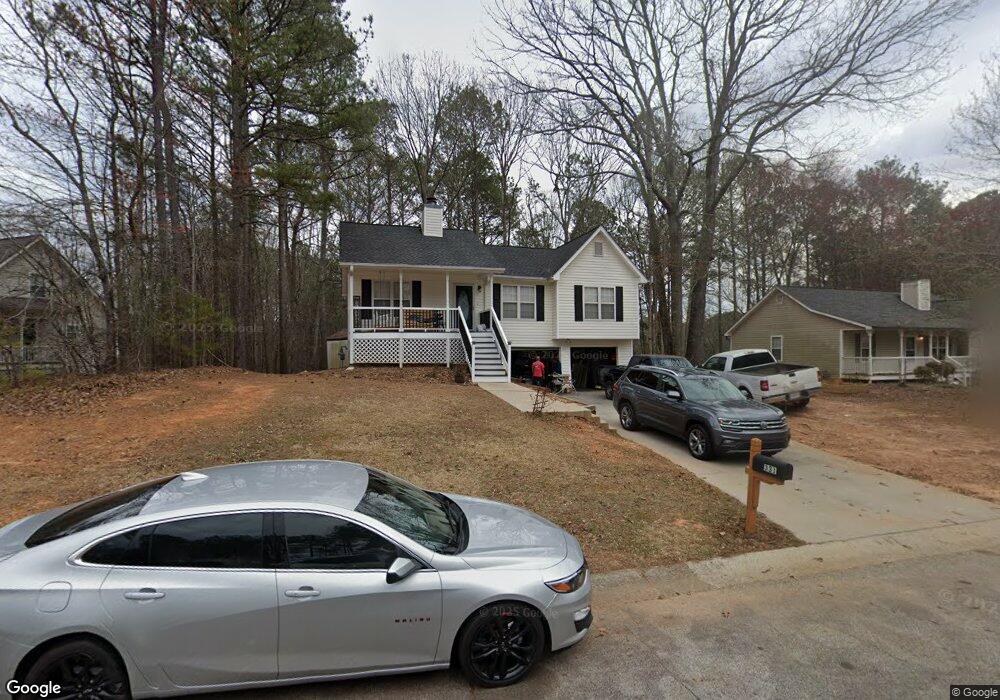
331 Madeline Way Temple, GA 30179
Estimated Value: $229,000 - $261,000
3
Beds
2
Baths
1,130
Sq Ft
$219/Sq Ft
Est. Value
About This Home
This home is located at 331 Madeline Way, Temple, GA 30179 and is currently estimated at $247,299, approximately $218 per square foot. 331 Madeline Way is a home located in Carroll County with nearby schools including Temple Elementary School, Temple Middle School, and Temple High School.
Ownership History
Date
Name
Owned For
Owner Type
Purchase Details
Closed on
Mar 24, 2017
Sold by
Thompson Elijah Beau
Bought by
Lindler Randy L
Current Estimated Value
Home Financials for this Owner
Home Financials are based on the most recent Mortgage that was taken out on this home.
Original Mortgage
$115,151
Outstanding Balance
$95,463
Interest Rate
4.16%
Mortgage Type
New Conventional
Estimated Equity
$151,836
Purchase Details
Closed on
Sep 3, 2015
Sold by
Tomes Dwight A
Bought by
Thompson Elijah Beau
Home Financials for this Owner
Home Financials are based on the most recent Mortgage that was taken out on this home.
Original Mortgage
$96,938
Interest Rate
3.94%
Mortgage Type
New Conventional
Purchase Details
Closed on
Jan 28, 2000
Sold by
B A R Homes Inc
Bought by
Tomes Dwight A
Purchase Details
Closed on
Jan 19, 1999
Bought by
B A R Homes Inc
Create a Home Valuation Report for This Property
The Home Valuation Report is an in-depth analysis detailing your home's value as well as a comparison with similar homes in the area
Home Values in the Area
Average Home Value in this Area
Purchase History
| Date | Buyer | Sale Price | Title Company |
|---|---|---|---|
| Lindler Randy L | $114,000 | -- | |
| Thompson Elijah Beau | $95,000 | -- | |
| Tomes Dwight A | $93,800 | -- | |
| B A R Homes Inc | -- | -- |
Source: Public Records
Mortgage History
| Date | Status | Borrower | Loan Amount |
|---|---|---|---|
| Open | Lindler Randy L | $115,151 | |
| Previous Owner | Thompson Elijah Beau | $96,938 |
Source: Public Records
Tax History Compared to Growth
Tax History
| Year | Tax Paid | Tax Assessment Tax Assessment Total Assessment is a certain percentage of the fair market value that is determined by local assessors to be the total taxable value of land and additions on the property. | Land | Improvement |
|---|---|---|---|---|
| 2024 | $2,848 | $106,335 | $7,200 | $99,135 |
| 2023 | $2,848 | $97,384 | $7,200 | $90,184 |
| 2022 | $2,409 | $79,627 | $7,200 | $72,427 |
| 2021 | $1,943 | $62,507 | $7,200 | $55,307 |
| 2020 | $1,638 | $52,480 | $7,200 | $45,280 |
| 2019 | $1,541 | $48,950 | $7,200 | $41,750 |
| 2018 | $1,258 | $38,832 | $4,000 | $34,832 |
| 2017 | $1,272 | $38,832 | $4,000 | $34,832 |
| 2016 | $1,248 | $38,832 | $4,000 | $34,832 |
| 2015 | $1,163 | $36,480 | $8,800 | $27,680 |
| 2014 | $1,169 | $36,480 | $8,800 | $27,680 |
Source: Public Records
Map
Nearby Homes
- 426 Amy Blvd
- 24 Mcclure Rd
- 248 Webster Lake Dr
- 242 Brookshire Dr
- 362 Webster Lake Dr
- 212 Webster Lake Dr
- 395 Pollard Rd
- 0 Us Highway 78 Unit 10533174
- 0 Us Highway 78 Unit 10533179
- 116 Tallapoosa St
- 115 Glen Helton Rd
- 0 Pollard Rd Unit 10533145
- 0 Pollard Rd Unit 10533156
- The Joiner Plan at School House Trace
- The McCurry Plan at School House Trace
- 128 Pollard Rd
- 400 Sapling Ct
- 96 Rome St
- 119 Sourwood Ln
- 136 Rainey Rd
- 331 Madeline Way Unit 130
- 325 Madeline Way
- 339 Madeline Way
- 112 Lydia Ct
- 317 Madeline Way
- 0 Madeline Way Unit 8708871
- 0 Madeline Way Unit 8654462
- 0 Madeline Way Unit 8685915
- W Madeline Way
- 0 Madeline Way Unit 8936659
- 0 Madeline Way Unit 7426790
- 106 Lydia Ct
- 330 Madeline Way
- 336 Madeline Way
- 342 Madeline Way
- 357 Madeline Way
- 311 Madeline Way
- 318 Madeline Way
- 348 Madeline Way
- 348 Madeline Way Unit 13