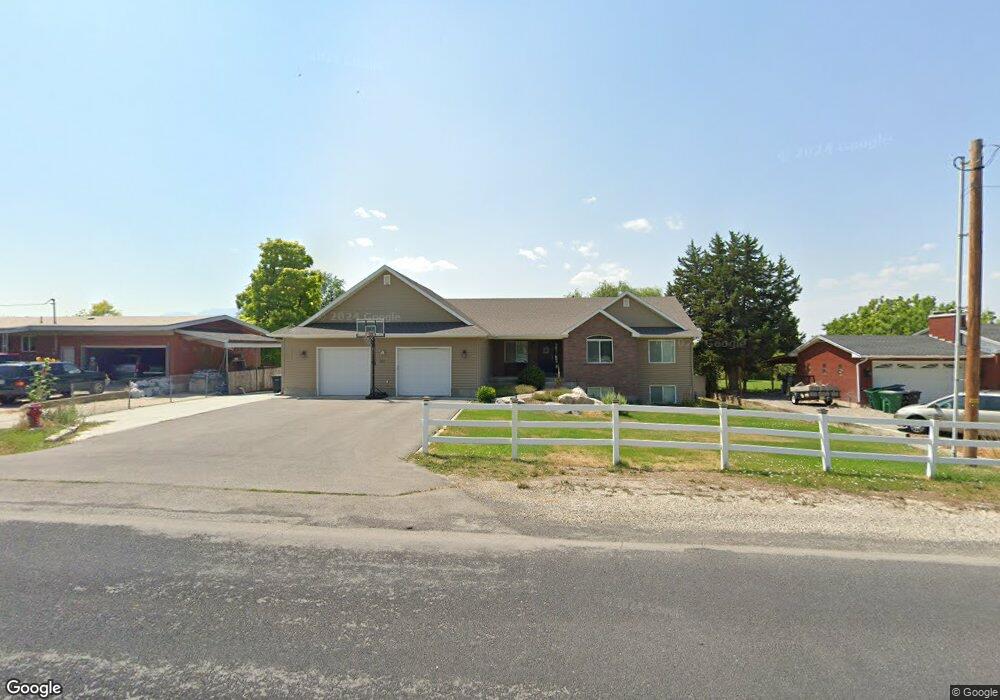
331 N 100 W Providence, UT 84332
Estimated Value: $495,000 - $650,000
5
Beds
3
Baths
3,790
Sq Ft
$154/Sq Ft
Est. Value
About This Home
This home is located at 331 N 100 W, Providence, UT 84332 and is currently estimated at $584,427, approximately $154 per square foot. 331 N 100 W is a home located in Cache County with nearby schools including River Heights School, Spring Creek Middle School, and South Cache Middle School.
Ownership History
Date
Name
Owned For
Owner Type
Purchase Details
Closed on
Jun 11, 2015
Sold by
Bishop Bryan L and Bishop Lindsay T
Bought by
Hsiao Tony and Hsiao Margaret
Current Estimated Value
Home Financials for this Owner
Home Financials are based on the most recent Mortgage that was taken out on this home.
Original Mortgage
$213,000
Outstanding Balance
$164,858
Interest Rate
3.81%
Mortgage Type
New Conventional
Estimated Equity
$419,569
Purchase Details
Closed on
Jun 27, 2006
Sold by
Gunnell Scott and Gunnell Desiree
Bought by
Bishop Bryan L and Bishop Lindsay T
Home Financials for this Owner
Home Financials are based on the most recent Mortgage that was taken out on this home.
Original Mortgage
$120,000
Interest Rate
6.57%
Mortgage Type
Purchase Money Mortgage
Create a Home Valuation Report for This Property
The Home Valuation Report is an in-depth analysis detailing your home's value as well as a comparison with similar homes in the area
Home Values in the Area
Average Home Value in this Area
Purchase History
| Date | Buyer | Sale Price | Title Company |
|---|---|---|---|
| Hsiao Tony | -- | Cache Title Logan | |
| Bishop Bryan L | -- | Northern Title Company |
Source: Public Records
Mortgage History
| Date | Status | Borrower | Loan Amount |
|---|---|---|---|
| Open | Hsiao Tony | $213,000 | |
| Previous Owner | Bishop Bryan L | $120,000 |
Source: Public Records
Tax History Compared to Growth
Tax History
| Year | Tax Paid | Tax Assessment Tax Assessment Total Assessment is a certain percentage of the fair market value that is determined by local assessors to be the total taxable value of land and additions on the property. | Land | Improvement |
|---|---|---|---|---|
| 2025 | $2,331 | $326,755 | $0 | $0 |
| 2024 | $2,492 | $325,045 | $0 | $0 |
| 2023 | $2,639 | $324,375 | $0 | $0 |
| 2022 | $2,359 | $273,830 | $0 | $0 |
| 2021 | $2,312 | $411,165 | $64,350 | $346,815 |
| 2020 | $2,030 | $334,807 | $64,350 | $270,457 |
| 2019 | $2,145 | $334,807 | $64,350 | $270,457 |
| 2018 | $1,879 | $299,530 | $64,350 | $235,180 |
| 2017 | $1,742 | $147,015 | $0 | $0 |
| 2016 | $1,761 | $147,015 | $0 | $0 |
| 2015 | $1,669 | $138,995 | $0 | $0 |
| 2014 | $1,628 | $138,995 | $0 | $0 |
| 2013 | -- | $138,995 | $0 | $0 |
Source: Public Records
Map
Nearby Homes