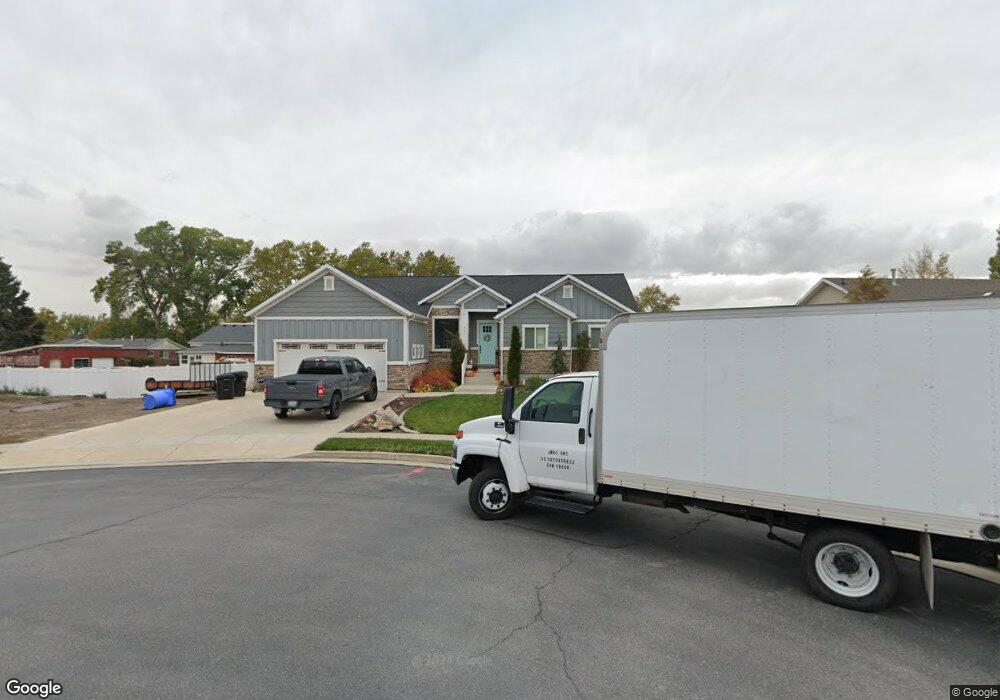
331 N 750 W West Bountiful, UT 84087
Estimated Value: $693,000 - $777,000
3
Beds
2
Baths
3,500
Sq Ft
$212/Sq Ft
Est. Value
About This Home
This home is located at 331 N 750 W, West Bountiful, UT 84087 and is currently estimated at $742,829, approximately $212 per square foot. 331 N 750 W is a home located in Davis County with nearby schools including West Bountiful Elementary School, Bountiful Junior High School, and Viewmont High School.
Ownership History
Date
Name
Owned For
Owner Type
Purchase Details
Closed on
Feb 28, 2015
Sold by
Hunsaker Brady
Bought by
Peterson Mark M and Peterson Dawn S
Current Estimated Value
Purchase Details
Closed on
Nov 14, 2013
Sold by
Hunsaker Brady
Bought by
Hunsaker Brady
Home Financials for this Owner
Home Financials are based on the most recent Mortgage that was taken out on this home.
Original Mortgage
$268,000
Interest Rate
4.17%
Mortgage Type
New Conventional
Purchase Details
Closed on
May 20, 2013
Sold by
My Enterprises Inc
Bought by
Hunsaker Brady
Home Financials for this Owner
Home Financials are based on the most recent Mortgage that was taken out on this home.
Original Mortgage
$248,000
Interest Rate
3.5%
Mortgage Type
Construction
Create a Home Valuation Report for This Property
The Home Valuation Report is an in-depth analysis detailing your home's value as well as a comparison with similar homes in the area
Home Values in the Area
Average Home Value in this Area
Purchase History
| Date | Buyer | Sale Price | Title Company |
|---|---|---|---|
| Peterson Mark M | -- | Cache Title Company | |
| Hunsaker Brady | -- | Cache Title Company | |
| Hunsaker Brady | -- | Aspen Title Insuranc |
Source: Public Records
Mortgage History
| Date | Status | Borrower | Loan Amount |
|---|---|---|---|
| Previous Owner | Hunsaker Brady | $268,000 | |
| Previous Owner | Hunsaker Brady | $248,000 |
Source: Public Records
Tax History Compared to Growth
Tax History
| Year | Tax Paid | Tax Assessment Tax Assessment Total Assessment is a certain percentage of the fair market value that is determined by local assessors to be the total taxable value of land and additions on the property. | Land | Improvement |
|---|---|---|---|---|
| 2025 | $4,180 | $363,550 | $164,810 | $198,740 |
| 2024 | $3,900 | $347,600 | $136,058 | $211,542 |
| 2023 | $3,878 | $636,000 | $253,620 | $382,380 |
| 2022 | $4,085 | $375,650 | $124,654 | $250,996 |
| 2021 | $3,475 | $488,000 | $173,876 | $314,124 |
| 2020 | $3,358 | $468,000 | $156,828 | $311,172 |
| 2019 | $3,370 | $465,000 | $154,745 | $310,255 |
| 2018 | $3,166 | $430,000 | $149,728 | $280,272 |
| 2016 | $2,659 | $195,360 | $44,409 | $150,951 |
| 2015 | $2,610 | $182,490 | $44,409 | $138,081 |
| 2014 | $2,485 | $178,777 | $44,409 | $134,368 |
| 2013 | -- | $67,292 | $67,292 | $0 |
Source: Public Records
Map
Nearby Homes
- 767 W 220 N
- 680 W 500 S Unit 22
- 680 W 500 S Unit 17
- 340 N 500 W Unit 204
- 280 N 1100 W
- 399 W 400 N Unit 47
- 790 N 500 W
- 167 S 425 W
- 825 W 1320 N
- 314 W Center St Unit D135
- 314 W Center St Unit D159
- 314 W Center St Unit E150
- 155 N Peregrine Ln W
- 75 N Peregrine Ln W Unit 8
- 366 W 1000 N
- 131 W 25 N Unit 4
- 147 W 25 N Unit 5
- 499 N 200 W Unit 30
- 499 N 200 W Unit 19
- 553 N 200 W