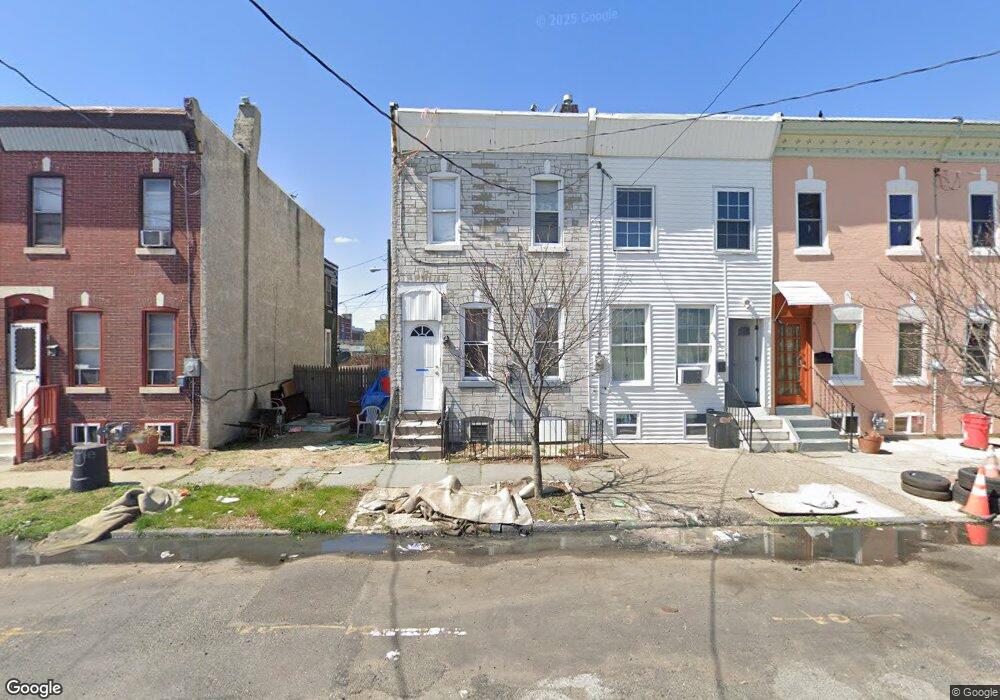
331 N 9th St Camden, NJ 08102
North Camden NeighborhoodEstimated Value: $94,602 - $153,000
--
Bed
--
Bath
1,039
Sq Ft
$120/Sq Ft
Est. Value
About This Home
This home is located at 331 N 9th St, Camden, NJ 08102 and is currently estimated at $124,901, approximately $120 per square foot. 331 N 9th St is a home located in Camden County with nearby schools including Eastside High School, Leap Academy University Charter School, and Holy Name School.
Ownership History
Date
Name
Owned For
Owner Type
Purchase Details
Closed on
Apr 18, 2022
Sold by
Gonzalez Carmen L
Bought by
Rodriguez William
Current Estimated Value
Purchase Details
Closed on
Jun 29, 1995
Sold by
Rodriguez Luis
Bought by
Gonzalez Carmen
Home Financials for this Owner
Home Financials are based on the most recent Mortgage that was taken out on this home.
Original Mortgage
$19,000
Interest Rate
7.49%
Create a Home Valuation Report for This Property
The Home Valuation Report is an in-depth analysis detailing your home's value as well as a comparison with similar homes in the area
Home Values in the Area
Average Home Value in this Area
Purchase History
| Date | Buyer | Sale Price | Title Company |
|---|---|---|---|
| Rodriguez William | -- | -- | |
| Gonzalez Carmen | $19,500 | -- |
Source: Public Records
Mortgage History
| Date | Status | Borrower | Loan Amount |
|---|---|---|---|
| Previous Owner | Gonzalez Carmen | $19,000 |
Source: Public Records
Tax History Compared to Growth
Tax History
| Year | Tax Paid | Tax Assessment Tax Assessment Total Assessment is a certain percentage of the fair market value that is determined by local assessors to be the total taxable value of land and additions on the property. | Land | Improvement |
|---|---|---|---|---|
| 2025 | $1,523 | $43,000 | $5,700 | $37,300 |
| 2024 | $1,473 | $43,000 | $5,700 | $37,300 |
| 2023 | $1,473 | $43,000 | $5,700 | $37,300 |
| 2022 | $1,445 | $43,000 | $5,700 | $37,300 |
| 2021 | $1,440 | $43,000 | $5,700 | $37,300 |
| 2020 | $1,367 | $43,000 | $5,700 | $37,300 |
| 2019 | $1,309 | $43,000 | $5,700 | $37,300 |
| 2018 | $1,302 | $43,000 | $5,700 | $37,300 |
| 2017 | $1,271 | $43,000 | $5,700 | $37,300 |
| 2016 | $1,230 | $43,000 | $5,700 | $37,300 |
| 2015 | $1,184 | $43,000 | $5,700 | $37,300 |
| 2014 | $1,156 | $43,000 | $5,700 | $37,300 |
Source: Public Records
Map
Nearby Homes