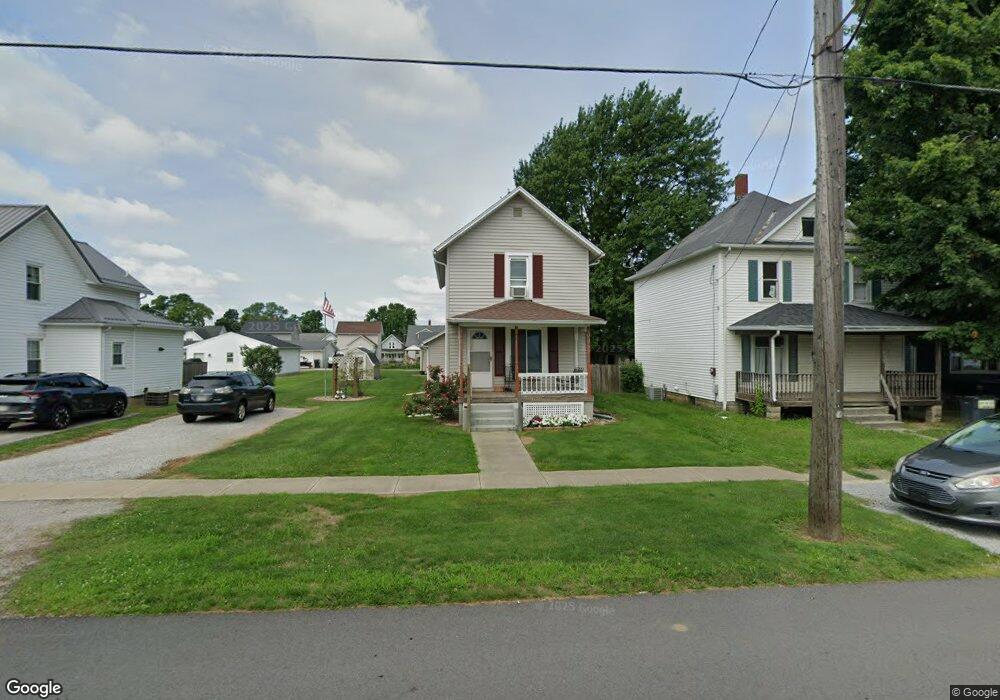
331 N Buckeye St Bellevue, OH 44811
Estimated Value: $128,950 - $166,000
2
Beds
1
Bath
1,104
Sq Ft
$133/Sq Ft
Est. Value
About This Home
This home is located at 331 N Buckeye St, Bellevue, OH 44811 and is currently estimated at $146,738, approximately $132 per square foot. 331 N Buckeye St is a home located in Huron County with nearby schools including Bellevue Elementary School, Bellevue Middle School, and Bellevue High School.
Ownership History
Date
Name
Owned For
Owner Type
Purchase Details
Closed on
Dec 29, 2010
Bought by
Aslinger J C
Current Estimated Value
Purchase Details
Closed on
Dec 8, 2010
Bought by
Us Bank National Association As Trustee
Purchase Details
Closed on
Dec 12, 2005
Bought by
Whitlock Jessica
Purchase Details
Closed on
Jan 28, 2005
Bought by
Chase Manhattan Mortgage
Purchase Details
Closed on
Sep 10, 2001
Bought by
Heileman Ruby
Purchase Details
Closed on
Feb 7, 2001
Bought by
Heileman Joseph
Purchase Details
Closed on
May 10, 2000
Sold by
Bussey David W
Bought by
Szymanowski Thomas W
Home Financials for this Owner
Home Financials are based on the most recent Mortgage that was taken out on this home.
Original Mortgage
$51,750
Interest Rate
7.88%
Mortgage Type
Balloon
Purchase Details
Closed on
Dec 13, 1974
Bought by
Bussey David W
Create a Home Valuation Report for This Property
The Home Valuation Report is an in-depth analysis detailing your home's value as well as a comparison with similar homes in the area
Home Values in the Area
Average Home Value in this Area
Purchase History
| Date | Buyer | Sale Price | Title Company |
|---|---|---|---|
| Aslinger J C | $7,500 | -- | |
| Us Bank National Association As Trustee | $23,300 | -- | |
| Whitlock Jessica | $64,100 | -- | |
| Chase Manhattan Mortgage | $46,700 | -- | |
| Heileman Ruby | -- | -- | |
| Heileman Joseph | -- | -- | |
| Szymanowski Thomas W | $69,000 | -- | |
| Bussey David W | $15,000 | -- |
Source: Public Records
Mortgage History
| Date | Status | Borrower | Loan Amount |
|---|---|---|---|
| Previous Owner | Szymanowski Thomas W | $51,750 |
Source: Public Records
Tax History Compared to Growth
Tax History
| Year | Tax Paid | Tax Assessment Tax Assessment Total Assessment is a certain percentage of the fair market value that is determined by local assessors to be the total taxable value of land and additions on the property. | Land | Improvement |
|---|---|---|---|---|
| 2024 | $956 | $33,310 | $6,120 | $27,190 |
| 2023 | $956 | $29,520 | $4,660 | $24,860 |
| 2022 | $1,306 | $29,520 | $4,660 | $24,860 |
| 2021 | $1,317 | $29,520 | $4,660 | $24,860 |
| 2020 | $1,123 | $23,790 | $4,660 | $19,130 |
| 2019 | $1,107 | $23,790 | $4,660 | $19,130 |
| 2018 | $1,093 | $23,790 | $4,660 | $19,130 |
| 2017 | $887 | $19,810 | $4,470 | $15,340 |
| 2016 | $866 | $19,810 | $4,470 | $15,340 |
| 2015 | $896 | $19,810 | $4,470 | $15,340 |
| 2014 | $884 | $19,180 | $4,480 | $14,700 |
| 2013 | $874 | $19,180 | $4,480 | $14,700 |
Source: Public Records
Map
Nearby Homes
- 303 Moore Ave
- 140 Harkness St
- 808 Castalia St
- 819 Castalia St
- 130 Huffman St
- 501 E Center St
- 817 E Main St
- 219 Huffman St
- 206 Southwest St
- 126 Greenwood Heights
- 124 Sunset Dr
- 408 W Main St
- 129 Hamilton St
- 154 Ashford Ave
- 140 Hobson St
- 155 Ashford Ave
- 231 Lawrence St
- 118 Maplewood
- 230 Highland Ave Unit 106
- 0 Oakwood Dr