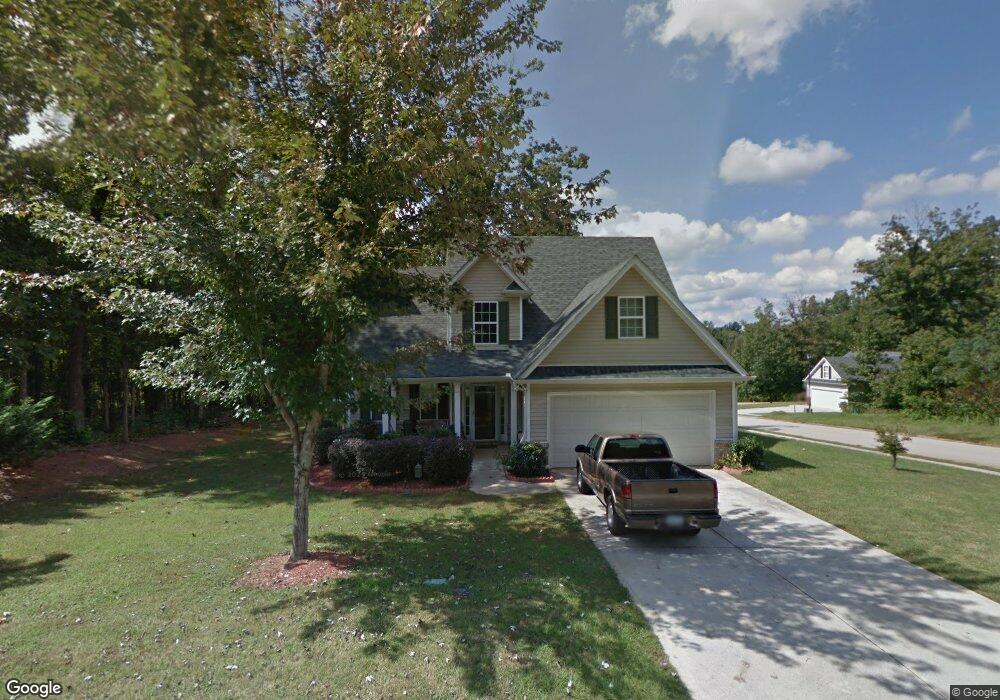
331 Northwood Dr Commerce, GA 30529
Commerce Township Downtown NeighborhoodEstimated Value: $316,676 - $351,000
3
Beds
3
Baths
1,507
Sq Ft
$217/Sq Ft
Est. Value
About This Home
This home is located at 331 Northwood Dr, Commerce, GA 30529 and is currently estimated at $326,919, approximately $216 per square foot. 331 Northwood Dr is a home located in Jackson County with nearby schools including Commerce Primary School, Commerce Elementary School, and Commerce Middle School.
Ownership History
Date
Name
Owned For
Owner Type
Purchase Details
Closed on
Dec 13, 2011
Sold by
Federal National Mortgage Association
Bought by
Gillespie Jewell David
Current Estimated Value
Home Financials for this Owner
Home Financials are based on the most recent Mortgage that was taken out on this home.
Original Mortgage
$86,632
Outstanding Balance
$59,404
Interest Rate
4.06%
Mortgage Type
New Conventional
Estimated Equity
$267,515
Purchase Details
Closed on
Sep 6, 2011
Sold by
Nationstar Mtg Llc
Bought by
Federal National Mtg
Purchase Details
Closed on
Jan 11, 2007
Sold by
Not Provided
Bought by
Wiley Donna Saye
Home Financials for this Owner
Home Financials are based on the most recent Mortgage that was taken out on this home.
Original Mortgage
$139,400
Interest Rate
6.08%
Mortgage Type
New Conventional
Purchase Details
Closed on
Feb 2, 2006
Sold by
Not Provided
Bought by
Wiley Donna Saye
Create a Home Valuation Report for This Property
The Home Valuation Report is an in-depth analysis detailing your home's value as well as a comparison with similar homes in the area
Home Values in the Area
Average Home Value in this Area
Purchase History
| Date | Buyer | Sale Price | Title Company |
|---|---|---|---|
| Gillespie Jewell David | $84,900 | -- | |
| Federal National Mtg | $116,316 | -- | |
| Wiley Donna Saye | $154,900 | -- | |
| Wiley Donna Saye | $38,500 | -- |
Source: Public Records
Mortgage History
| Date | Status | Borrower | Loan Amount |
|---|---|---|---|
| Open | Federal National Mtg | $86,632 | |
| Previous Owner | Wiley Donna Saye | $139,400 |
Source: Public Records
Tax History Compared to Growth
Tax History
| Year | Tax Paid | Tax Assessment Tax Assessment Total Assessment is a certain percentage of the fair market value that is determined by local assessors to be the total taxable value of land and additions on the property. | Land | Improvement |
|---|---|---|---|---|
| 2024 | $2,178 | $108,480 | $28,000 | $80,480 |
| 2023 | $2,178 | $99,560 | $28,000 | $71,560 |
| 2022 | $1,827 | $85,880 | $28,000 | $57,880 |
| 2021 | $1,455 | $74,880 | $17,000 | $57,880 |
| 2020 | $1,058 | $59,040 | $10,400 | $48,640 |
| 2019 | $1,079 | $59,040 | $10,400 | $48,640 |
| 2018 | $992 | $56,680 | $10,400 | $46,280 |
| 2017 | $874 | $53,125 | $10,400 | $42,725 |
| 2016 | $1,980 | $53,125 | $10,400 | $42,725 |
| 2015 | $1,812 | $47,525 | $4,800 | $42,725 |
| 2014 | $1,536 | $39,959 | $4,800 | $35,159 |
| 2013 | -- | $46,163 | $4,800 | $41,363 |
Source: Public Records
Map
Nearby Homes
- 2234 Remington Dr
- 2309 Remington Dr
- 396 Old Harden Orchard Rd
- 224 Welsh Cir
- 330 Stella St Lot 03
- Austin Plan at Austin Ridge
- Woodbury Plan at Austin Ridge
- Montrose Plan at Austin Ridge
- Franklin Plan at Austin Ridge
- Peachwood Plan at Austin Ridge
- Kathleen Plan at Austin Ridge
- 80 Sherwood Dr Unit LOT 06
- 225 Dr
- 196 Sage St Homesite 30
- 47
- 103 Sherwood Dr Lot 16 Dr
- 151 Sage St Lot 38 Dr
- 207 Sage St Lot 35 Dr
- 125 Sherwood Dr Lot 15 Dr
- 189 Dr
- 311 Northwood Dr
- 1323 Charleston Ave
- 1312 Charleston Ave
- 330 Northwood Dr
- 2181 Remington Dr
- 1294 Charleston Ave
- 310 Northwood Dr
- 295 Northwood Dr Unit 114
- 295 Northwood Dr
- 1324 Charleston Ave
- 13825 Charleston Ave
- 2197 Remington Dr
- 1345 Charleston Ave
- 290 Northwood Dr
- 287 Northwood Dr
- 1350 Charleston Ave
- 2188 Remington Dr
- 2215 Remington Dr
- 1365 Charleston Ave Unit 34
- 1365 Charleston Ave