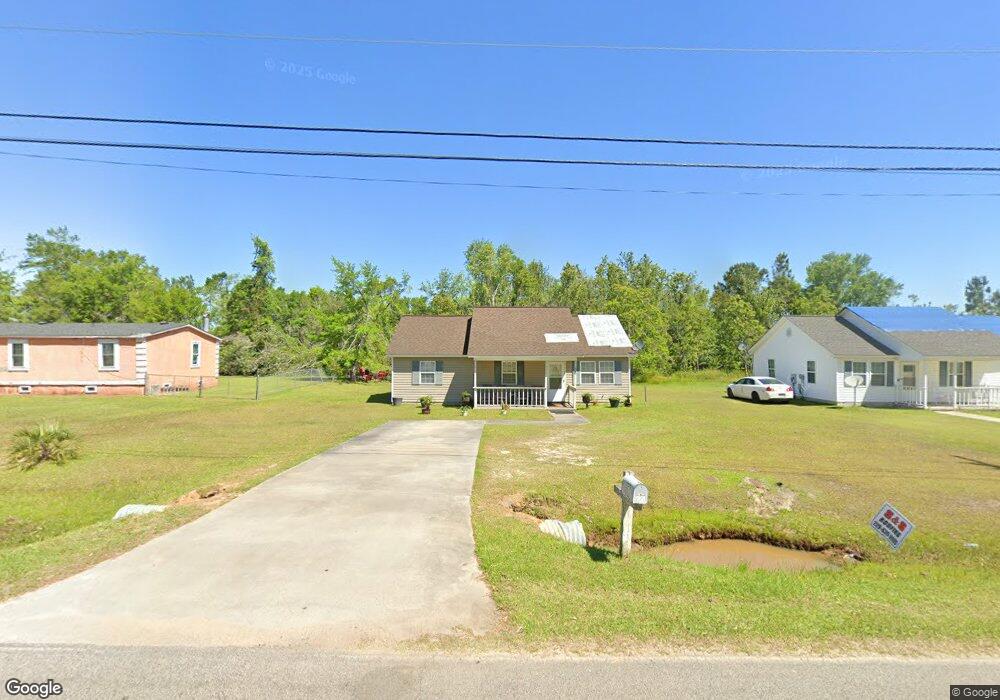
331 Pinecrest Dr Douglas, GA 31535
Estimated Value: $108,818 - $175,000
3
Beds
2
Baths
1,120
Sq Ft
$129/Sq Ft
Est. Value
About This Home
This home is located at 331 Pinecrest Dr, Douglas, GA 31535 and is currently estimated at $144,955, approximately $129 per square foot. 331 Pinecrest Dr is a home located in Coffee County with nearby schools including Satilla Elementary School, Coffee Middle School, and Coffee County High School.
Ownership History
Date
Name
Owned For
Owner Type
Purchase Details
Closed on
Feb 28, 2008
Sold by
Us Bank
Bought by
Timmons Shakena C
Current Estimated Value
Home Financials for this Owner
Home Financials are based on the most recent Mortgage that was taken out on this home.
Original Mortgage
$53,980
Outstanding Balance
$32,965
Interest Rate
5.63%
Mortgage Type
New Conventional
Estimated Equity
$111,990
Purchase Details
Closed on
May 31, 2006
Sold by
Second Chance Homes Llc
Bought by
Snell Markita M
Home Financials for this Owner
Home Financials are based on the most recent Mortgage that was taken out on this home.
Original Mortgage
$73,950
Interest Rate
9.95%
Mortgage Type
New Conventional
Purchase Details
Closed on
Apr 27, 2006
Sold by
New Century Home Equity Tr
Bought by
Second Chance Homes Llc
Home Financials for this Owner
Home Financials are based on the most recent Mortgage that was taken out on this home.
Original Mortgage
$73,950
Interest Rate
9.95%
Mortgage Type
New Conventional
Create a Home Valuation Report for This Property
The Home Valuation Report is an in-depth analysis detailing your home's value as well as a comparison with similar homes in the area
Purchase History
| Date | Buyer | Sale Price | Title Company |
|---|---|---|---|
| Timmons Shakena C | $52,900 | -- | |
| Snell Markita M | $87,000 | -- | |
| Second Chance Homes Llc | $59,000 | -- |
Source: Public Records
Mortgage History
| Date | Status | Borrower | Loan Amount |
|---|---|---|---|
| Open | Timmons Shakena C | $53,980 | |
| Previous Owner | Snell Markita M | $73,950 | |
| Previous Owner | Second Chance Homes Llc | $58,756 |
Source: Public Records
Tax History
| Year | Tax Paid | Tax Assessment Tax Assessment Total Assessment is a certain percentage of the fair market value that is determined by local assessors to be the total taxable value of land and additions on the property. | Land | Improvement |
|---|---|---|---|---|
| 2025 | $664 | $24,382 | $4,000 | $20,382 |
| 2024 | $661 | $24,382 | $4,000 | $20,382 |
| 2023 | $113 | $23,402 | $4,000 | $19,402 |
| 2022 | $716 | $23,402 | $4,000 | $19,402 |
| 2021 | $716 | $23,402 | $4,000 | $19,402 |
| 2020 | $717 | $23,402 | $4,000 | $19,402 |
| 2019 | $717 | $23,402 | $4,000 | $19,402 |
| 2018 | $717 | $23,402 | $4,000 | $19,402 |
| 2017 | $720 | $23,402 | $4,000 | $19,402 |
| 2016 | $721 | $23,402 | $4,000 | $19,402 |
| 2015 | $725 | $23,402 | $4,000 | $19,402 |
| 2014 | $728 | $23,402 | $4,000 | $19,402 |
Source: Public Records
Map
Nearby Homes
- 0 Bowens Mill Rd Unit 116593
- 508 Pine St
- 44 Miller Rd
- 808 Glendale Ave
- 1021 Evergreen Ln
- 1260 Old Bell Lake Rd
- 1305 Old Bell Lake Rd
- 285 English St
- 775 Lakeview Ave
- 820 Bowens Mill Rd
- 133 English St
- 721 E Bryan St
- 1270 Woodland Heights
- 406 Irma Ave
- 1 Hwy 441 S
- 112 Eldridge Ln
- 0001 W Ocilla Road Or Hwy 32 W
- 201 Gaskin Ave N
- 204 Gaskin Ave N
- 00 Ward St E
- 329 Pinecrest Dr
- 333 Pinecrest Dr
- 335 Pinecrest Dr
- 326 Pinecrest Dr
- 326 Pinecrest Dr
- 324 Pinecrest Dr
- 328 Pinecrest Dr
- 405 Pinecrest Dr
- 330 Pinecrest Dr
- 407 Pinecrest Dr
- 321 Tippin Dr
- 228 Pinecrest Dr
- 341 Tippin Dr
- 1742 Gaskin Ave S
- 1802 Elmwood Dr Unit 1
- 1802 Elmwood Dr
- 226 Pinecrest Dr
- 221 Tippin Dr
- 320 Tippin Dr
- 300 Tippin Dr
Your Personal Tour Guide
Ask me questions while you tour the home.