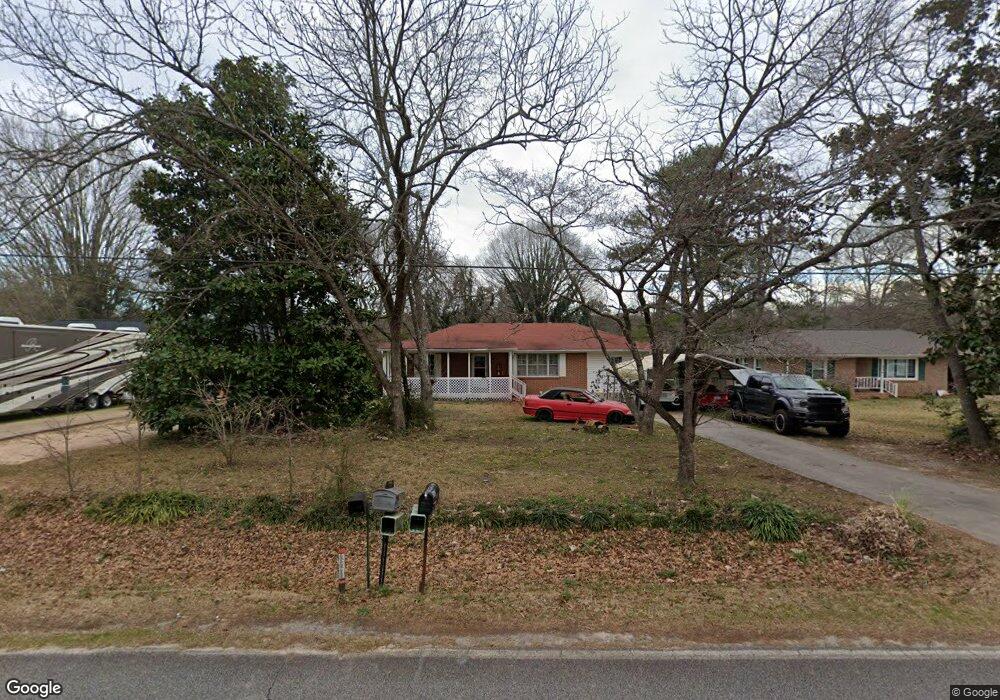
331 Rehoboth Rd Griffin, GA 30223
Spalding County NeighborhoodEstimated Value: $160,015 - $200,000
3
Beds
1
Bath
1,047
Sq Ft
$167/Sq Ft
Est. Value
About This Home
This home is located at 331 Rehoboth Rd, Griffin, GA 30223 and is currently estimated at $174,504, approximately $166 per square foot. 331 Rehoboth Rd is a home located in Spalding County with nearby schools including Futral Road Elementary School, Rehoboth Road Middle School, and Spalding High School.
Ownership History
Date
Name
Owned For
Owner Type
Purchase Details
Closed on
Mar 5, 2021
Sold by
Alred Janice M
Bought by
Pamsey Samuel Naithan
Current Estimated Value
Purchase Details
Closed on
Jan 9, 1986
Sold by
Alred Comer L and Alred Janice M
Bought by
Alred Janice M
Purchase Details
Closed on
Feb 7, 1984
Sold by
White Earl
Bought by
Alred Comer L and Alred Janice M
Purchase Details
Closed on
Jan 8, 1981
Sold by
Jones Houston
Bought by
White Earl
Purchase Details
Closed on
Aug 27, 1980
Sold by
Colson Leon and Colson Betty M
Bought by
Jones Houston
Purchase Details
Closed on
Aug 15, 1979
Sold by
Blankenship Shirley
Bought by
Colson Leon and Colson Betty M
Purchase Details
Closed on
Dec 8, 1978
Sold by
Blankenship Marvin E
Bought by
Blankenship Shirley
Purchase Details
Closed on
Jun 16, 1967
Sold by
Murray George N
Bought by
Blankenship Marvin E
Purchase Details
Closed on
Mar 20, 1967
Sold by
Greer Thomas S and Greer Betty T
Bought by
Murray George N
Purchase Details
Closed on
Dec 29, 1965
Bought by
Greer Thoms S and Greer Betty T
Create a Home Valuation Report for This Property
The Home Valuation Report is an in-depth analysis detailing your home's value as well as a comparison with similar homes in the area
Home Values in the Area
Average Home Value in this Area
Purchase History
| Date | Buyer | Sale Price | Title Company |
|---|---|---|---|
| Pamsey Samuel Naithan | -- | -- | |
| Alred Janice M | -- | -- | |
| Alred Comer L | -- | -- | |
| White Earl | $5,200 | -- | |
| Jones Houston | $2,000 | -- | |
| Colson Leon | $29,900 | -- | |
| Blankenship Shirley | $25,900 | -- | |
| Blankenship Marvin E | $3,900 | -- | |
| Murray George N | $1,700 | -- | |
| Greer Thoms S | -- | -- |
Source: Public Records
Tax History
| Year | Tax Paid | Tax Assessment Tax Assessment Total Assessment is a certain percentage of the fair market value that is determined by local assessors to be the total taxable value of land and additions on the property. | Land | Improvement |
|---|---|---|---|---|
| 2025 | $1,559 | $45,371 | $5,200 | $40,171 |
| 2024 | $1,542 | $45,371 | $5,200 | $40,171 |
| 2023 | $1,559 | $45,371 | $5,200 | $40,171 |
| 2022 | $1,407 | $40,510 | $4,000 | $36,510 |
| 2021 | $602 | $26,641 | $4,000 | $22,641 |
| 2020 | $605 | $26,641 | $4,000 | $22,641 |
| 2019 | $934 | $25,100 | $4,000 | $21,100 |
| 2018 | $503 | $23,478 | $4,000 | $19,478 |
| 2017 | $478 | $23,478 | $4,000 | $19,478 |
| 2016 | $486 | $23,478 | $4,000 | $19,478 |
| 2015 | $507 | $23,478 | $4,000 | $19,478 |
| 2014 | $510 | $23,478 | $4,000 | $19,478 |
Source: Public Records
Map
Nearby Homes
- 103 Julie Cir
- 225 Griffin Park Rd
- 407 E Brooks Ave
- 224 Eastbrook Ave
- 1532 High Falls Rd
- 213 Eastbrook Ave
- 211 Eastbrook Ave
- 119 Banks Rd
- 502 Searcy Ave
- 1029 High Falls Rd
- 1471 Macon Rd
- 315 Powell Ave
- 2014 High Falls Rd
- 1014 E College St
- 132 Lang St
- 404 Woodcreek
- 715 Sleepy Hollow
- 230 Sapelo Rd
- 410 Dora St
- 963 E Solomon St
- 339 Rehoboth Rd
- 321 Rehoboth Rd
- 315 Rehoboth Rd
- 312 Elizabeth Ln
- 345 Rehoboth Rd
- 310 Elizabeth Ln
- 314 Elizabeth Ln
- 308 Elizabeth Ln
- 307 Rehoboth Rd
- 328 Rehoboth Rd
- 326 Rehoboth Rd
- 344 Rehoboth Rd
- 306 Elizabeth Ln
- 312 Rehoboth Rd
- 318 Elizabeth Ln
- 363 Rehoboth Rd
- 304 Rehoboth Rd
- 293 Rehoboth Rd
- 360 Rehoboth Rd
- 307 Elizabeth Ln
Your Personal Tour Guide
Ask me questions while you tour the home.