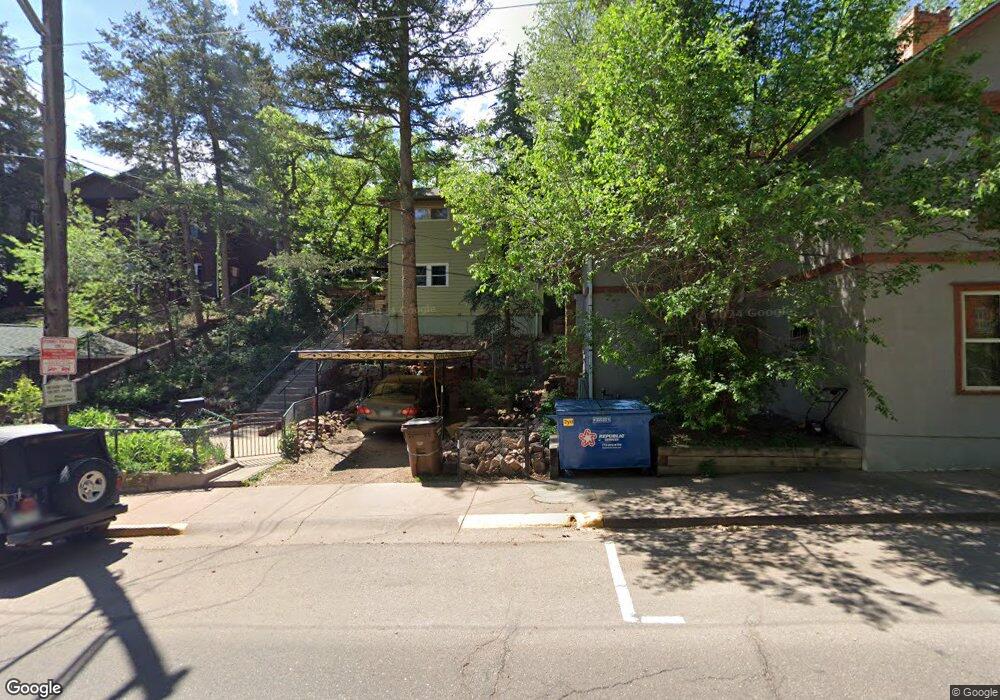
331 Ruxton Ave Manitou Springs, CO 80829
Estimated Value: $442,966 - $731,000
2
Beds
3
Baths
1,058
Sq Ft
$581/Sq Ft
Est. Value
About This Home
This home is located at 331 Ruxton Ave, Manitou Springs, CO 80829 and is currently estimated at $614,492, approximately $580 per square foot. 331 Ruxton Ave is a home with nearby schools including Manitou Springs Elementary School, Manitou Springs Middle School, and Manitou Springs High School.
Ownership History
Date
Name
Owned For
Owner Type
Purchase Details
Closed on
Apr 26, 2019
Sold by
Mason John and Mason Carol
Bought by
Knudsen Pmk Peter M
Current Estimated Value
Home Financials for this Owner
Home Financials are based on the most recent Mortgage that was taken out on this home.
Original Mortgage
$368,207
Outstanding Balance
$319,821
Interest Rate
3.62%
Mortgage Type
FHA
Estimated Equity
$294,671
Purchase Details
Closed on
Oct 22, 2001
Sold by
Derr James Paul
Bought by
Mason John and Mason Carol
Purchase Details
Closed on
Apr 29, 1997
Sold by
Jones Michael G
Bought by
Derr James Paul
Home Financials for this Owner
Home Financials are based on the most recent Mortgage that was taken out on this home.
Original Mortgage
$129,550
Interest Rate
7.97%
Mortgage Type
FHA
Purchase Details
Closed on
Mar 10, 1992
Bought by
Mason John
Purchase Details
Closed on
Mar 1, 1990
Bought by
Mason Carol
Purchase Details
Closed on
Mar 1, 1985
Bought by
Mason John
Create a Home Valuation Report for This Property
The Home Valuation Report is an in-depth analysis detailing your home's value as well as a comparison with similar homes in the area
Home Values in the Area
Average Home Value in this Area
Purchase History
| Date | Buyer | Sale Price | Title Company |
|---|---|---|---|
| Knudsen Pmk Peter M | $375,000 | Fidelity National Title | |
| Mason John | $168,000 | Security Title | |
| Derr James Paul | $131,000 | Stewart Title | |
| Mason John | $29,000 | -- | |
| Mason Carol | -- | -- | |
| Mason John | -- | -- |
Source: Public Records
Mortgage History
| Date | Status | Borrower | Loan Amount |
|---|---|---|---|
| Open | Knudsen Pmk Peter M | $368,207 | |
| Previous Owner | Derr James Paul | $129,550 |
Source: Public Records
Tax History Compared to Growth
Tax History
| Year | Tax Paid | Tax Assessment Tax Assessment Total Assessment is a certain percentage of the fair market value that is determined by local assessors to be the total taxable value of land and additions on the property. | Land | Improvement |
|---|---|---|---|---|
| 2025 | $2,103 | $31,510 | -- | -- |
| 2024 | $1,922 | $32,350 | $3,540 | $28,810 |
| 2022 | $1,730 | $23,400 | $3,260 | $20,140 |
| 2021 | $1,835 | $24,490 | $3,430 | $21,060 |
| 2020 | $1,607 | $20,430 | $2,860 | $17,570 |
| 2019 | $1,706 | $20,430 | $2,860 | $17,570 |
| 2018 | $1,581 | $17,970 | $2,220 | $15,750 |
| 2017 | $1,398 | $17,970 | $2,220 | $15,750 |
| 2016 | $1,369 | $17,590 | $2,230 | $15,360 |
| 2015 | $1,353 | $17,590 | $2,230 | $15,360 |
| 2014 | $1,167 | $16,130 | $1,970 | $14,160 |
Source: Public Records
Map
Nearby Homes
- 151 Ruxton Ave
- 125 Ruxton Ave
- 153 Capitol Hill Ave
- 210 Mesa Ave
- 206 Pine Ridge Ave
- 1107 Manitou Ave
- 1117 Manitou Ave
- 128 Cave Ave
- 0 Manitou Terrace
- 136 Cave Ave
- 0 Charcas Rd Unit REC3377987
- 0 Charcas Rd Unit 1024513
- 140 Cave Ave
- 527 Canon Ave
- 529 Canon Ave
- 105 Pawnee Ave
- 103 Deer Path Ave
- 135 South Path
- 1096 Laguna Point
- 34 Fountain Place
- 319 Ruxton Ave
- 333 Ruxton Ave Unit MAN
- 333 Ruxton Ave
- 331 Spring St
- 339 Ruxton Ave
- 341 Ruxton Ave
- 325 Spring St
- 320 Ruxton Ave
- 328 Spring St
- 324 Ruxton Ave
- 347 Ruxton Ave
- 332 Ruxton Ave
- 318 Ruxton Ave
- 344 Ruxton Ave
- 349 Ruxton Ave
- 347 Spring St
- 342 Ruxton Ave
- 324 Spring St
- 352 Ruxton Ave
- 312 Ruxton Ave