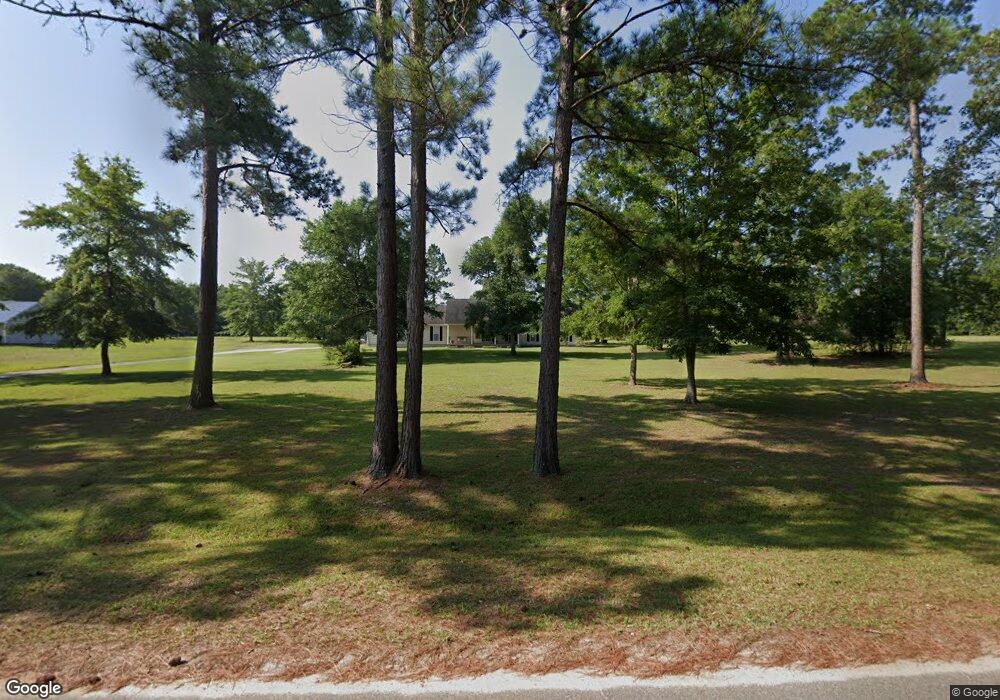
331 S Cedar Creek Rd Cordele, GA 31015
Estimated Value: $292,000 - $583,000
3
Beds
2
Baths
1,904
Sq Ft
$208/Sq Ft
Est. Value
About This Home
This home is located at 331 S Cedar Creek Rd, Cordele, GA 31015 and is currently estimated at $396,542, approximately $208 per square foot. 331 S Cedar Creek Rd is a home located in Crisp County with nearby schools including Crisp County Elementary School, Crisp County Primary School, and Crisp County Middle School.
Ownership History
Date
Name
Owned For
Owner Type
Purchase Details
Closed on
Dec 19, 2013
Sold by
Wells Fargo Bank National
Bought by
Grantham Sonua Renee
Current Estimated Value
Home Financials for this Owner
Home Financials are based on the most recent Mortgage that was taken out on this home.
Original Mortgage
$125,510
Outstanding Balance
$93,958
Interest Rate
4.25%
Mortgage Type
New Conventional
Estimated Equity
$302,584
Purchase Details
Closed on
Jul 2, 2013
Sold by
Giacona June B
Bought by
Wells Fargo Bank National Asso
Purchase Details
Closed on
Feb 28, 2006
Sold by
Quick Tim
Bought by
Giacona June B
Home Financials for this Owner
Home Financials are based on the most recent Mortgage that was taken out on this home.
Original Mortgage
$110,000
Interest Rate
6.19%
Mortgage Type
New Conventional
Purchase Details
Closed on
Apr 24, 2002
Sold by
Suntrust Bank
Bought by
Quick Tim
Purchase Details
Closed on
Jun 27, 2001
Sold by
Way Robert F
Bought by
Quick Tim
Create a Home Valuation Report for This Property
The Home Valuation Report is an in-depth analysis detailing your home's value as well as a comparison with similar homes in the area
Home Values in the Area
Average Home Value in this Area
Purchase History
| Date | Buyer | Sale Price | Title Company |
|---|---|---|---|
| Grantham Sonua Renee | $123,000 | -- | |
| Wells Fargo Bank National Asso | -- | -- | |
| Giacona June B | $162,000 | -- | |
| Quick Tim | -- | -- | |
| Quick Tim | $30,000 | -- |
Source: Public Records
Mortgage History
| Date | Status | Borrower | Loan Amount |
|---|---|---|---|
| Open | Grantham Sonua Renee | $125,510 | |
| Previous Owner | Giacona June B | $110,000 |
Source: Public Records
Tax History Compared to Growth
Tax History
| Year | Tax Paid | Tax Assessment Tax Assessment Total Assessment is a certain percentage of the fair market value that is determined by local assessors to be the total taxable value of land and additions on the property. | Land | Improvement |
|---|---|---|---|---|
| 2024 | $2,311 | $85,350 | $17,600 | $67,750 |
| 2023 | $2,301 | $81,933 | $17,600 | $64,333 |
| 2022 | $2,205 | $78,514 | $17,600 | $60,914 |
| 2021 | $2,227 | $75,096 | $17,600 | $57,496 |
| 2020 | $2,230 | $75,096 | $17,600 | $57,496 |
| 2019 | $2,216 | $75,096 | $17,600 | $57,496 |
| 2018 | $2,115 | $69,070 | $13,200 | $55,870 |
| 2017 | $2,124 | $69,070 | $13,200 | $55,870 |
| 2016 | $2,121 | $69,070 | $13,200 | $55,870 |
Source: Public Records
Map
Nearby Homes
- 475 N Cedar Creek Rd
- 228 Cedar Point Cir
- 251 N Cedar Creek Rd
- 141 Landing Rd
- 153 Landing Rd
- 984 Scenic Route
- 103 Cedar Slough Ct
- 111 Cedar Creek Rd S
- 850 Scenic Route
- 0 Coney Rd S
- 0 Lot #3 & Part Lot#4 Unit 59461
- Lot 1, 2 Scenic Route
- 580 Scenic Route
- Lot 3,4 Scenic Route
- 687 Flintside Dr
- 629 Cork Ferry Rd
- 119 Wolfs Thick Rd
- 115 Ellis Ct
- 631 Flintside Dr
- 600 Scenic Route
- 323 S Cedar Creek Rd
- 332 S Cedar Creek Rd
- 117 Ray Rd
- 342 S Cedar Creek Rd
- 334 S Cedar Creek Rd
- 123 Ray Rd
- 384 S Cedar Creek Rd
- 346 S Cedar Creek Rd
- 330 S Cedar Creek Rd
- 326 S Cedar Creek Rd
- 328 S Cedar Creek Rd
- 120 Ray Rd
- 322 S Cedar Creek Rd
- 350 S Cedar Creek Rd
- 129 Ray Rd
- 320 S Cedar Creek Rd
- 124 Ray Rd
- 318 S Cedar Creek Rd
- 354 S Cedar Creek Rd
- 354 S Cedar Creek Rd