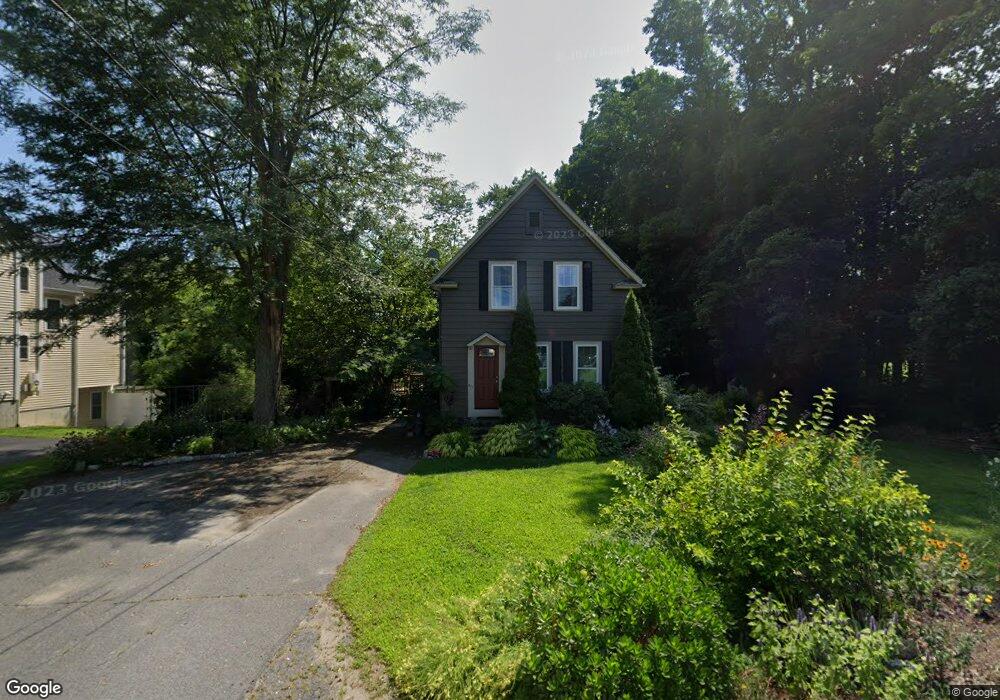
331 Summer St Bridgewater, MA 02324
Estimated Value: $456,004 - $582,000
3
Beds
1
Bath
1,080
Sq Ft
$455/Sq Ft
Est. Value
About This Home
This home is located at 331 Summer St, Bridgewater, MA 02324 and is currently estimated at $491,501, approximately $455 per square foot. 331 Summer St is a home located in Plymouth County with nearby schools including Mitchell Elementary School, Williams Intermediate School, and Bridgewater Middle School.
Ownership History
Date
Name
Owned For
Owner Type
Purchase Details
Closed on
Jun 27, 2005
Sold by
Fritz John R
Bought by
Manning Kathy L and Oconnell Kenneth R
Current Estimated Value
Purchase Details
Closed on
Jul 23, 1997
Sold by
Dennis Robert W
Bought by
Fritz John R
Purchase Details
Closed on
Apr 28, 1997
Sold by
Preti Columbo C and Preti Lorraine E
Bought by
Dennis Robert W
Create a Home Valuation Report for This Property
The Home Valuation Report is an in-depth analysis detailing your home's value as well as a comparison with similar homes in the area
Home Values in the Area
Average Home Value in this Area
Purchase History
| Date | Buyer | Sale Price | Title Company |
|---|---|---|---|
| Manning Kathy L | $313,000 | -- | |
| Fritz John R | $129,900 | -- | |
| Dennis Robert W | $79,900 | -- |
Source: Public Records
Mortgage History
| Date | Status | Borrower | Loan Amount |
|---|---|---|---|
| Open | Dennis Robert W | $93,724 | |
| Closed | Dennis Robert W | $80,000 |
Source: Public Records
Tax History
| Year | Tax Paid | Tax Assessment Tax Assessment Total Assessment is a certain percentage of the fair market value that is determined by local assessors to be the total taxable value of land and additions on the property. | Land | Improvement |
|---|---|---|---|---|
| 2025 | $4,481 | $378,800 | $185,100 | $193,700 |
| 2024 | $4,361 | $359,200 | $176,300 | $182,900 |
| 2023 | $4,310 | $335,700 | $164,700 | $171,000 |
| 2022 | $4,220 | $294,700 | $144,500 | $150,200 |
| 2021 | $3,566 | $246,300 | $129,000 | $117,300 |
| 2020 | $3,520 | $239,000 | $124,100 | $114,900 |
| 2019 | $3,492 | $235,500 | $124,100 | $111,400 |
| 2018 | $17,566 | $220,600 | $120,500 | $100,100 |
| 2017 | $3,323 | $212,900 | $120,500 | $92,400 |
| 2016 | $3,221 | $207,300 | $118,100 | $89,200 |
| 2015 | $3,253 | $200,300 | $114,700 | $85,600 |
| 2014 | $3,180 | $195,700 | $111,300 | $84,400 |
Source: Public Records
Map
Nearby Homes
- 120 Worcester St
- 220 Bedford St Unit 32
- 220 Bedford St Unit 86
- 30 Sanger St
- 51 Cottage St
- 167 Spring St
- 0 Bedford St Unit 73480500
- 35 Nelson Dr
- 47 Hale St
- 1 Anacki Ln Unit 1
- 118 Plesant St
- 398 Plymouth St
- 57 Stetson St
- 180 Main St Unit 6109
- 180 Main St Unit 4105
- 5 Heather Ln
- 0 Flagg St Unit 73421818
- 150 Prattown Ln
- 120 Mary Ln Unit 3
- 1 Jennifer Cir
Your Personal Tour Guide
Ask me questions while you tour the home.