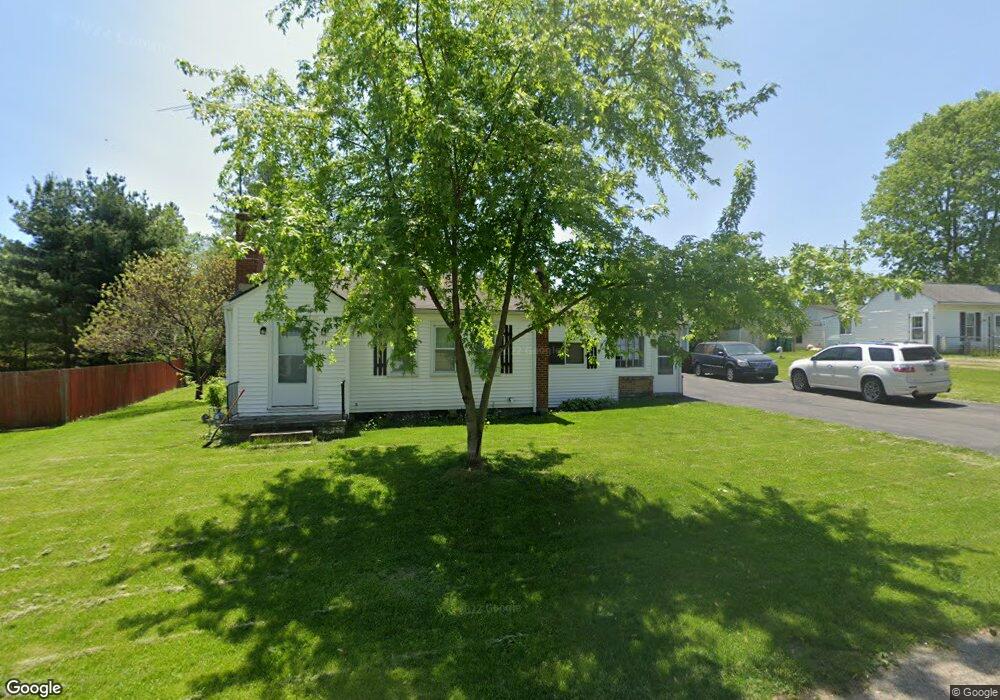
331 Sycamore Rd Medway, OH 45341
Estimated Value: $92,000 - $143,961
3
Beds
1
Bath
1,032
Sq Ft
$125/Sq Ft
Est. Value
About This Home
This home is located at 331 Sycamore Rd, Medway, OH 45341 and is currently estimated at $128,740, approximately $124 per square foot. 331 Sycamore Rd is a home located in Clark County with nearby schools including Park Layne Elementary School, Donnelsville Elementary School, and New Carlisle Elementary School.
Ownership History
Date
Name
Owned For
Owner Type
Purchase Details
Closed on
Dec 10, 2002
Sold by
Greenpoint Mtg Funding Inc
Bought by
Ancona James L
Current Estimated Value
Home Financials for this Owner
Home Financials are based on the most recent Mortgage that was taken out on this home.
Original Mortgage
$51,300
Outstanding Balance
$22,052
Interest Rate
6.25%
Mortgage Type
Purchase Money Mortgage
Estimated Equity
$106,688
Purchase Details
Closed on
Oct 8, 2002
Sold by
Federal Home Loan Mortgage Corporation
Bought by
Greenpoint Mtg Funding Inc
Purchase Details
Closed on
Jun 21, 2002
Sold by
Sherman Dora J
Bought by
Federal Home Loan Mortgage Corporation
Purchase Details
Closed on
Aug 18, 1999
Sold by
Ferguson Clayton
Bought by
Sherman Dora J
Home Financials for this Owner
Home Financials are based on the most recent Mortgage that was taken out on this home.
Original Mortgage
$58,500
Interest Rate
7.59%
Mortgage Type
Purchase Money Mortgage
Create a Home Valuation Report for This Property
The Home Valuation Report is an in-depth analysis detailing your home's value as well as a comparison with similar homes in the area
Home Values in the Area
Average Home Value in this Area
Purchase History
| Date | Buyer | Sale Price | Title Company |
|---|---|---|---|
| Ancona James L | $54,000 | -- | |
| Greenpoint Mtg Funding Inc | -- | -- | |
| Federal Home Loan Mortgage Corporation | $55,000 | -- | |
| Sherman Dora J | $65,000 | Titlequest Agency Inc |
Source: Public Records
Mortgage History
| Date | Status | Borrower | Loan Amount |
|---|---|---|---|
| Open | Ancona James L | $51,300 | |
| Previous Owner | Sherman Dora J | $58,500 |
Source: Public Records
Tax History Compared to Growth
Tax History
| Year | Tax Paid | Tax Assessment Tax Assessment Total Assessment is a certain percentage of the fair market value that is determined by local assessors to be the total taxable value of land and additions on the property. | Land | Improvement |
|---|---|---|---|---|
| 2024 | $1,378 | $29,370 | $5,730 | $23,640 |
| 2023 | $1,378 | $29,370 | $5,730 | $23,640 |
| 2022 | $1,380 | $29,370 | $5,730 | $23,640 |
| 2021 | $1,281 | $24,910 | $4,000 | $20,910 |
| 2020 | $1,284 | $24,910 | $4,000 | $20,910 |
| 2019 | $1,320 | $24,910 | $4,000 | $20,910 |
| 2018 | $1,085 | $19,420 | $3,210 | $16,210 |
| 2017 | $1,079 | $19,233 | $3,210 | $16,023 |
| 2016 | $1,033 | $19,233 | $3,210 | $16,023 |
| 2015 | $1,205 | $19,233 | $3,210 | $16,023 |
| 2014 | $1,198 | $19,233 | $3,210 | $16,023 |
| 2013 | $990 | $15,481 | $3,210 | $12,271 |
Source: Public Records
Map
Nearby Homes
- 326 Kennedy Dr
- 0 Kennedy Rd
- 819 Hedwick St
- 16 Laurel Rd
- 1037 Frayne Dr
- 419 E Carpenter Dr
- 842 Edgewick Rd
- 1689 Dale Ridge Rd
- 12165 Dille Rd
- 634 Bowser Dr
- 1292 Medway New Carlisle Rd
- 212 Monroe Way
- 209 Monroe Way
- 11315 W National Rd
- 738 S Medway Carlisle Rd
- 0 N Dayton-Lakeview Rd Unit 944532
- 0 N Dayton-Lakeview Rd Unit 1041631
- 11501 Zeller Dr
- 9892 S Palmer Rd
- 10850 Musselman Rd
- 343 Sycamore Rd
- 336 Rosewood Rd
- 336 Sycamore Rd
- 344 Rosewood Rd
- 334 Tulip Rd Unit 1
- 326 Rosewood Rd
- 348 Rosewood Rd
- 320 Sycamore Rd
- 319 Sycamore Rd
- 319 Sycamore Rd
- 319 Sycamore Rd
- 319 Sycamore Rd
- 1940 Lincoln Rd
- 321 Rosewood Rd
- 321 Rosewood Rd
- 321 Rosewood Rd
- 321 Rosewood Rd
- 349 Rosewood Rd
- 1917 Lincoln Rd
- 1313 Lakeshore Dr