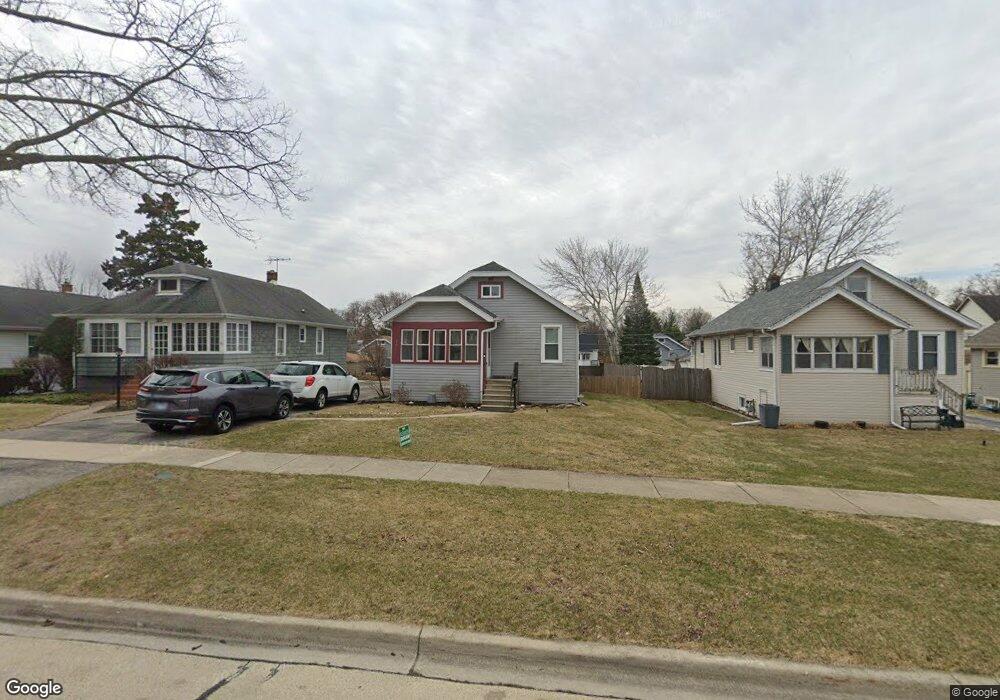
331 W Brookfield St Lombard, IL 60148
North Lombard NeighborhoodEstimated Value: $287,551 - $326,000
--
Bed
--
Bath
834
Sq Ft
$374/Sq Ft
Est. Value
About This Home
This home is located at 331 W Brookfield St, Lombard, IL 60148 and is currently estimated at $311,888, approximately $373 per square foot. 331 W Brookfield St is a home located in DuPage County with nearby schools including Park View Elementary School, Pleasant Lane Elementary School, and Wm Hammerschmidt Elementary School.
Ownership History
Date
Name
Owned For
Owner Type
Purchase Details
Closed on
Mar 17, 2020
Sold by
Glennon Alice J and Glennon Bernacki Alice
Bought by
Glennon Bernacki Alice J and Alice J Glennon Bernacki Declaration Of
Current Estimated Value
Purchase Details
Closed on
Jan 8, 2007
Sold by
Eddington Alice J and Glennon Alice J
Bought by
Glennon Alice J
Home Financials for this Owner
Home Financials are based on the most recent Mortgage that was taken out on this home.
Original Mortgage
$150,000
Outstanding Balance
$89,640
Interest Rate
6.21%
Mortgage Type
Stand Alone Refi Refinance Of Original Loan
Estimated Equity
$222,248
Purchase Details
Closed on
Oct 24, 1995
Sold by
Old Kent Bank
Bought by
Eddington Alice J
Home Financials for this Owner
Home Financials are based on the most recent Mortgage that was taken out on this home.
Original Mortgage
$94,000
Interest Rate
7.42%
Create a Home Valuation Report for This Property
The Home Valuation Report is an in-depth analysis detailing your home's value as well as a comparison with similar homes in the area
Home Values in the Area
Average Home Value in this Area
Purchase History
| Date | Buyer | Sale Price | Title Company |
|---|---|---|---|
| Glennon Bernacki Alice J | -- | None Available | |
| Glennon Alice J | -- | First American Title | |
| Eddington Alice J | $118,000 | Attorneys Title Guaranty Fun |
Source: Public Records
Mortgage History
| Date | Status | Borrower | Loan Amount |
|---|---|---|---|
| Open | Glennon Alice J | $150,000 | |
| Previous Owner | Eddington Alice J | $94,000 |
Source: Public Records
Tax History Compared to Growth
Tax History
| Year | Tax Paid | Tax Assessment Tax Assessment Total Assessment is a certain percentage of the fair market value that is determined by local assessors to be the total taxable value of land and additions on the property. | Land | Improvement |
|---|---|---|---|---|
| 2024 | $5,303 | $84,252 | $21,433 | $62,819 |
| 2023 | $5,622 | $77,910 | $19,820 | $58,090 |
| 2022 | $5,497 | $74,890 | $19,050 | $55,840 |
| 2021 | $5,322 | $73,030 | $18,580 | $54,450 |
| 2020 | $5,207 | $71,430 | $18,170 | $53,260 |
| 2019 | $4,939 | $67,910 | $17,270 | $50,640 |
| 2018 | $4,584 | $61,230 | $15,570 | $45,660 |
| 2017 | $4,899 | $63,680 | $19,290 | $44,390 |
| 2016 | $4,756 | $59,990 | $18,170 | $41,820 |
| 2015 | $4,482 | $55,890 | $16,930 | $38,960 |
| 2014 | $4,436 | $53,940 | $21,070 | $32,870 |
| 2013 | $4,371 | $54,700 | $21,370 | $33,330 |
Source: Public Records
Map
Nearby Homes
- 230 Troy Ln
- 229 W Berkshire Ave
- 201 W Crystal Ave
- 206 Troy Ln
- 22 N Columbine Ave
- 602 Glenwood Ln
- 333 W Potomac Ave
- 600 W Pleasant Ln Unit A2
- 201 W Potomac Ave
- 251 Cimarron Rd E
- 306 W Sunset Ave
- 78 N Elizabeth St
- 350 Cimarron Rd E
- 140 W Sunset Ave
- 21W065 Sunset Ave
- 124 W Sunset Ave
- 49 Orchard Terrace Unit 1
- 260 N Charlotte St
- 546 N Main St
- 555 W Saint Charles Rd
- 333 W Brookfield St
- 327 W Brookfield St
- 321 W Brookfield St
- 337 W Brookfield St
- 330 W Brookfield St
- 319 W Brookfield St
- 345 W Brookfield St
- 332 W View St
- 328 W View St
- 326 W Brookfield St
- 309 N West Rd
- 322 W Brookfield St
- 315 W Brookfield St
- 324 W View St
- 336 W Brookfield St
- 336 W View St
- 338 W View St
- 309 N West Rd
- 320 W View St
- 342 W Brookfield St