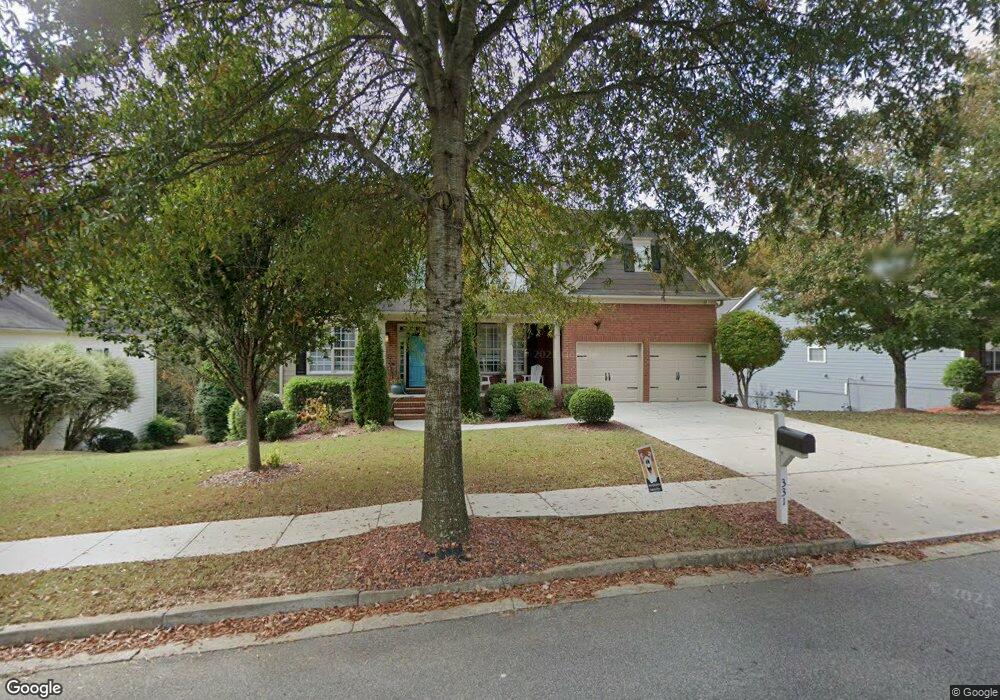
331 Windsong Way Woodstock, GA 30188
Estimated Value: $632,853 - $635,000
4
Beds
3
Baths
2,833
Sq Ft
$224/Sq Ft
Est. Value
About This Home
This home is located at 331 Windsong Way, Woodstock, GA 30188 and is currently estimated at $633,927, approximately $223 per square foot. 331 Windsong Way is a home located in Cherokee County with nearby schools including Woodstock Elementary School, Woodstock Middle School, and Woodstock High School.
Ownership History
Date
Name
Owned For
Owner Type
Purchase Details
Closed on
Mar 11, 2011
Sold by
Dobson Properties Inc
Bought by
Olmeda Miguel and Gamez-Olmeda Melissa
Current Estimated Value
Home Financials for this Owner
Home Financials are based on the most recent Mortgage that was taken out on this home.
Original Mortgage
$223,915
Outstanding Balance
$153,634
Interest Rate
4.76%
Mortgage Type
New Conventional
Estimated Equity
$480,293
Purchase Details
Closed on
Sep 8, 2010
Sold by
Perina Gary L
Bought by
Dobson Properties Inc
Purchase Details
Closed on
Dec 20, 2005
Sold by
Johnson Anita
Bought by
Perina Gary L
Home Financials for this Owner
Home Financials are based on the most recent Mortgage that was taken out on this home.
Original Mortgage
$225,600
Interest Rate
6.18%
Mortgage Type
New Conventional
Purchase Details
Closed on
May 24, 2002
Sold by
Mccar Development Corp
Bought by
Johnson Anita
Create a Home Valuation Report for This Property
The Home Valuation Report is an in-depth analysis detailing your home's value as well as a comparison with similar homes in the area
Home Values in the Area
Average Home Value in this Area
Purchase History
| Date | Buyer | Sale Price | Title Company |
|---|---|---|---|
| Olmeda Miguel | $235,700 | -- | |
| Dobson Properties Inc | -- | -- | |
| Perina Gary L | $282,000 | -- | |
| Johnson Anita | $261,800 | -- |
Source: Public Records
Mortgage History
| Date | Status | Borrower | Loan Amount |
|---|---|---|---|
| Open | Olmeda Miguel | $223,915 | |
| Previous Owner | Perina Gary L | $225,600 |
Source: Public Records
Tax History Compared to Growth
Tax History
| Year | Tax Paid | Tax Assessment Tax Assessment Total Assessment is a certain percentage of the fair market value that is determined by local assessors to be the total taxable value of land and additions on the property. | Land | Improvement |
|---|---|---|---|---|
| 2024 | $6,585 | $232,276 | $44,800 | $187,476 |
| 2023 | $1,255 | $234,720 | $44,800 | $189,920 |
| 2022 | $5,677 | $194,080 | $40,000 | $154,080 |
| 2021 | $4,548 | $180,760 | $32,000 | $148,760 |
| 2020 | $5,274 | $166,200 | $22,000 | $144,200 |
| 2019 | $3,746 | $148,960 | $22,000 | $126,960 |
| 2018 | $3,380 | $133,480 | $22,000 | $111,480 |
| 2017 | $3,256 | $319,000 | $22,000 | $105,600 |
| 2016 | $2,979 | $289,300 | $20,000 | $95,720 |
| 2015 | $2,770 | $266,700 | $20,000 | $86,680 |
| 2014 | $2,546 | $244,600 | $20,000 | $77,840 |
Source: Public Records
Map
Nearby Homes
- The Barrington Plan at South on Main
- 9244 Main St Unit 102
- 1100 Thomas St
- 1104 Thomas St
- 967 S On Main Dr
- 963 S On Main Dr
- 191 Fowler St
- 202 Dawson Dr
- 200 Dawson Dr
- 170 Fowler St Unit 100
- 170 Fowler St Unit 200
- 108 Barnesdale Terrace
- 308 Chardonnay Way
- 147 Hubbard Rd
- 110 Barnesdale Terrace
- 304 Winchester Way
- 228 Dawson Dr
- 719 Hammond Dr
- 333 Windsong Way
- 227 Morning Mist Ln
- 335 Windsong Way
- 327 Windsong Way
- 701 Song Bird Way
- 700 Song Bird Way
- 228 Morning Mist Ln
- 225 Morning Mist Ln
- 337 Windsong Way
- 325 Windsong Way
- 703 Songbird Way
- 322 Windsong Way
- 316 Windsong Way
- 324 Windstong Way
- 324 Windsong Way
- 703 Song Bird Way
- 702 Song Bird Way
- 223 Morning Mist Ln
- 339 Windsong Way
- 226 Morning Mist Ln