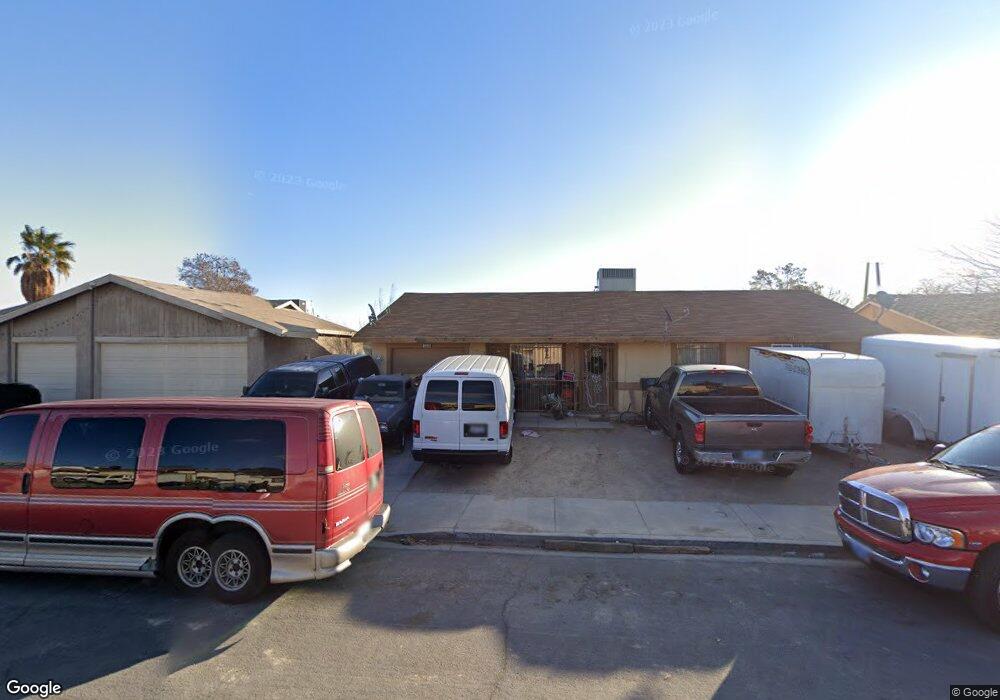
3310 Covey Ln Las Vegas, NV 89115
Estimated Value: $289,000 - $336,223
3
Beds
2
Baths
1,208
Sq Ft
$265/Sq Ft
Est. Value
About This Home
This home is located at 3310 Covey Ln, Las Vegas, NV 89115 and is currently estimated at $320,306, approximately $265 per square foot. 3310 Covey Ln is a home located in Clark County with nearby schools including Clyde C. Cox Elementary School, Gwendolyn Woolley Elementary School, and Von Tobel Middle School.
Ownership History
Date
Name
Owned For
Owner Type
Purchase Details
Closed on
Apr 24, 2013
Sold by
Montano Joel
Bought by
Montano Refugio O
Current Estimated Value
Purchase Details
Closed on
Oct 21, 2004
Sold by
Santana Ramon E
Bought by
Montano Joel
Purchase Details
Closed on
Oct 18, 2004
Sold by
Montano Joel
Bought by
Montano Joel and Montano Refugio
Purchase Details
Closed on
Jun 24, 1999
Sold by
Santana Sonia E
Bought by
Santana Ramon E
Home Financials for this Owner
Home Financials are based on the most recent Mortgage that was taken out on this home.
Original Mortgage
$84,450
Interest Rate
7.05%
Purchase Details
Closed on
Jun 22, 1999
Sold by
Yarling William and Yarling Linda
Bought by
Santana Ramon E
Home Financials for this Owner
Home Financials are based on the most recent Mortgage that was taken out on this home.
Original Mortgage
$84,450
Interest Rate
7.05%
Create a Home Valuation Report for This Property
The Home Valuation Report is an in-depth analysis detailing your home's value as well as a comparison with similar homes in the area
Home Values in the Area
Average Home Value in this Area
Purchase History
| Date | Buyer | Sale Price | Title Company |
|---|---|---|---|
| Montano Refugio O | -- | None Available | |
| Montano Joel | $120,000 | -- | |
| Montano Joel | -- | -- | |
| Santana Ramon E | -- | United Title | |
| Santana Ramon E | $89,000 | United Title |
Source: Public Records
Mortgage History
| Date | Status | Borrower | Loan Amount |
|---|---|---|---|
| Previous Owner | Santana Ramon E | $84,450 |
Source: Public Records
Tax History Compared to Growth
Tax History
| Year | Tax Paid | Tax Assessment Tax Assessment Total Assessment is a certain percentage of the fair market value that is determined by local assessors to be the total taxable value of land and additions on the property. | Land | Improvement |
|---|---|---|---|---|
| 2025 | $731 | $46,952 | $24,500 | $22,452 |
| 2024 | $678 | $46,952 | $24,500 | $22,452 |
| 2023 | $678 | $48,568 | $26,250 | $22,318 |
| 2022 | $628 | $43,538 | $22,750 | $20,788 |
| 2021 | $581 | $39,421 | $19,250 | $20,171 |
| 2020 | $537 | $38,938 | $18,550 | $20,388 |
| 2019 | $503 | $35,821 | $15,400 | $20,421 |
| 2018 | $480 | $30,657 | $10,710 | $19,947 |
| 2017 | $451 | $30,980 | $10,500 | $20,480 |
| 2016 | $451 | $25,890 | $8,050 | $17,840 |
| 2015 | $450 | $23,951 | $6,300 | $17,651 |
| 2014 | $436 | $14,408 | $3,500 | $10,908 |
Source: Public Records
Map
Nearby Homes
- 3401 N Walnut Rd Unit 330
- 3401 N Walnut Rd Unit 121
- 3401 N Walnut Rd Unit 113
- 3401 N Walnut Rd Unit 109
- 3401 N Walnut Rd Unit 388
- 3401 N Walnut Rd Unit 235
- 3401 N Walnut Rd Unit 15
- 3401 N Walnut Rd Unit 236
- 3401 N Walnut Rd Unit 74
- 3401 N Walnut Rd Unit 13
- 3401 N Walnut Rd Unit 6
- 3401 N Walnut Rd Unit 402
- 3401 N Walnut Rd Unit 249
- 3401 N Walnut Rd Unit 304
- 3401 N Walnut Rd Unit 67
- 3401 N Walnut Rd Unit 107
- 3401 N Walnut Rd Unit 272
- 3327 Rio Grande St
- 3540 Purdue
- 3630 Three Bars Ct
- 3302 Covey Ln
- 3326 Covey Ln
- 3294 Covey Ln
- 3309 Sandy Ln
- 3317 Sandy Ln
- 3301 Sandy Ln
- 3334 Covey Ln
- 3325 Sandy Ln
- 3295 Sandy Ln
- 3284 Covey Ln
- 3315 Covey Ln
- 3333 Sandy Ln Unit 1
- 3325 Covey Ln
- 3342 Covey Ln
- 3289 Covey Ln Unit 3291
- 3274 Covey Ln
- 3335 Covey Ln Unit 4
- 3335 Covey Ln
- 3341 Sandy Ln
- 3285 Covey Ln