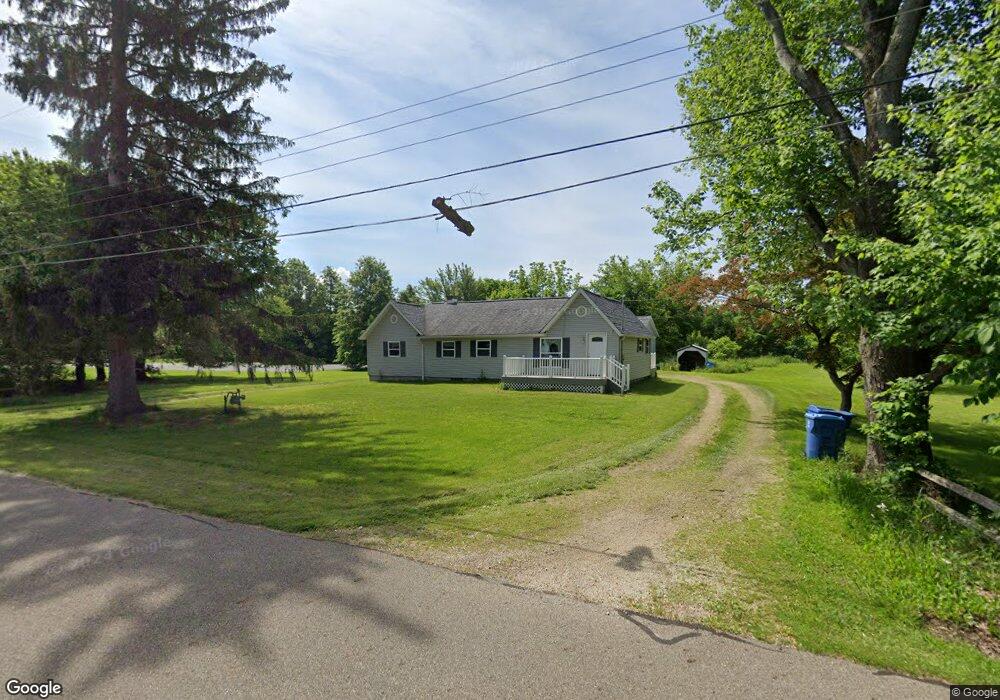
3310 Grenfall Rd Norton, OH 44203
Estimated Value: $200,420 - $246,000
2
Beds
1
Bath
1,144
Sq Ft
$193/Sq Ft
Est. Value
About This Home
This home is located at 3310 Grenfall Rd, Norton, OH 44203 and is currently estimated at $220,855, approximately $193 per square foot. 3310 Grenfall Rd is a home located in Summit County with nearby schools including Norton Primary Elementary School, Norton Middle School, and Norton High School.
Ownership History
Date
Name
Owned For
Owner Type
Purchase Details
Closed on
Jul 13, 2009
Sold by
Deutsche Bank National Trust Company
Bought by
Mast James
Current Estimated Value
Purchase Details
Closed on
Mar 31, 2009
Sold by
Schlauch Sandra E
Bought by
Deutsche Bank National Trust Company and Saxon Asset Securities Trust 2007-1
Purchase Details
Closed on
May 8, 2003
Sold by
Queden Sandra E and Queden Nicholas N
Bought by
Schlauch Sandra E
Home Financials for this Owner
Home Financials are based on the most recent Mortgage that was taken out on this home.
Original Mortgage
$80,800
Interest Rate
5.87%
Purchase Details
Closed on
Nov 20, 2000
Sold by
Queden David C
Bought by
Queden Sandra E
Create a Home Valuation Report for This Property
The Home Valuation Report is an in-depth analysis detailing your home's value as well as a comparison with similar homes in the area
Home Values in the Area
Average Home Value in this Area
Purchase History
| Date | Buyer | Sale Price | Title Company |
|---|---|---|---|
| Mast James | $22,500 | Attorney | |
| Deutsche Bank National Trust Company | $70,000 | None Available | |
| Schlauch Sandra E | -- | -- | |
| Queden Sandra E | -- | -- |
Source: Public Records
Mortgage History
| Date | Status | Borrower | Loan Amount |
|---|---|---|---|
| Previous Owner | Schlauch Sandra E | $80,800 |
Source: Public Records
Tax History
| Year | Tax Paid | Tax Assessment Tax Assessment Total Assessment is a certain percentage of the fair market value that is determined by local assessors to be the total taxable value of land and additions on the property. | Land | Improvement |
|---|---|---|---|---|
| 2024 | $2,285 | $55,741 | $15,526 | $40,215 |
| 2023 | $2,285 | $55,741 | $15,526 | $40,215 |
| 2022 | $2,364 | $47,369 | $12,726 | $34,643 |
| 2021 | $1,988 | $39,680 | $12,726 | $26,954 |
| 2020 | $1,857 | $39,680 | $12,730 | $26,950 |
| 2019 | $1,758 | $33,010 | $11,960 | $21,050 |
| 2018 | $1,729 | $33,010 | $11,960 | $21,050 |
| 2017 | $1,737 | $33,010 | $11,960 | $21,050 |
| 2016 | $1,737 | $30,380 | $11,960 | $18,420 |
| 2015 | $1,737 | $30,380 | $11,960 | $18,420 |
| 2014 | $1,721 | $30,380 | $11,960 | $18,420 |
| 2013 | $1,913 | $34,130 | $11,960 | $22,170 |
Source: Public Records
Map
Nearby Homes
- 3785 S Cleveland Massillon Rd
- 2910 S/L 17 Willow Way
- 2891 S/L 10 Willow Way
- 3754 Alumina Dr
- 3755 Alumina Dr
- 2943 S/L 5 Willow Way
- 2887 Greenridge Rd
- 3707 Creedmor Rd
- 3705 Creedmor Rd
- 3691 Lebbens Rd
- 2971 S/L 2 Willow Way
- 3080 Pleasant Dr
- 2958 Moyer Ave
- 2902 S/L 16 Willow Way
- 3726 Alumina Dr
- V/L 3837 S Cleveland Massillon Rd
- 3720 S Cleveland Massillon Rd
- 3582 Greenwich Rd
- 3738 Kirkham Dr
- 3339 Weber Dr
- 3330 Grenfall Rd
- 3307 Grenfall Rd
- 3319 Grenfall Rd
- 3297 Grenfall Rd
- 3327 Grenfall Rd
- 3283 Grenfall Rd
- 3443 Easton Rd
- 3401 Easton Rd
- 3273 Grenfall Rd
- 3264 Grenfall Rd
- 3385 Easton Rd
- 3259 Grenfall Rd
- 3248 Grenfall Rd
- 3375 Easton Rd
- 3394 Easton Rd
- 3483 Easton Rd
- 3432 Easton Rd
- 3247 Grenfall Rd
- 3363 Easton Rd
- 3236 Grenfall Rd
Your Personal Tour Guide
Ask me questions while you tour the home.