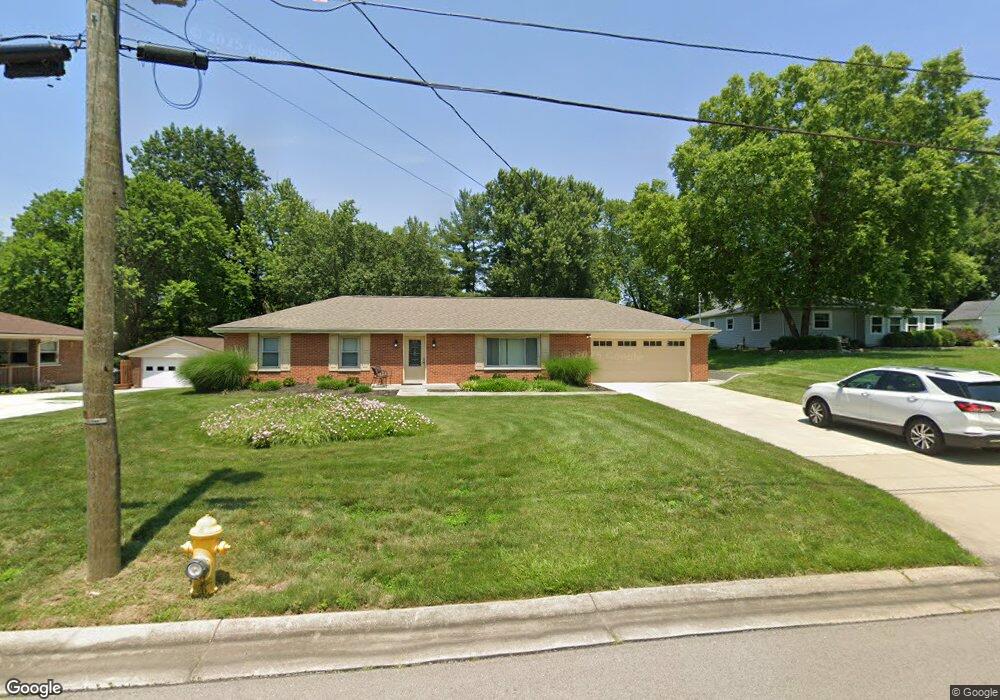
3310 Plateau Place Cincinnati, OH 45241
Estimated Value: $406,647 - $580,000
3
Beds
2
Baths
2,128
Sq Ft
$221/Sq Ft
Est. Value
About This Home
This home is located at 3310 Plateau Place, Cincinnati, OH 45241 and is currently estimated at $470,662, approximately $221 per square foot. 3310 Plateau Place is a home located in Hamilton County with nearby schools including Evendale Elementary School, Glendale Elementary School, and Princeton Community Middle School.
Ownership History
Date
Name
Owned For
Owner Type
Purchase Details
Closed on
Apr 16, 2018
Sold by
Rupard Tosha L
Bought by
Dbj Properties Llc
Current Estimated Value
Home Financials for this Owner
Home Financials are based on the most recent Mortgage that was taken out on this home.
Interest Rate
4.42%
Purchase Details
Closed on
Feb 8, 2018
Sold by
Rupard Mitchell S
Bought by
Rupard Tosha L
Purchase Details
Closed on
Jan 26, 2017
Sold by
Rupard Tosha L
Bought by
Rupard Mitchell S
Purchase Details
Closed on
Apr 30, 2010
Sold by
Glorius James H and Glorius Cynthia M
Bought by
Rupard Mitchell S and Rupard Tosha L
Home Financials for this Owner
Home Financials are based on the most recent Mortgage that was taken out on this home.
Original Mortgage
$157,874
Interest Rate
5.3%
Mortgage Type
FHA
Create a Home Valuation Report for This Property
The Home Valuation Report is an in-depth analysis detailing your home's value as well as a comparison with similar homes in the area
Home Values in the Area
Average Home Value in this Area
Purchase History
| Date | Buyer | Sale Price | Title Company |
|---|---|---|---|
| Dbj Properties Llc | $200,000 | -- | |
| Rupard Tosha L | -- | None Available | |
| Rupard Mitchell S | -- | -- | |
| Rupard Mitchell S | $160,000 | Ltoc |
Source: Public Records
Mortgage History
| Date | Status | Borrower | Loan Amount |
|---|---|---|---|
| Closed | Dbj Properties Llc | -- | |
| Previous Owner | Rupard Mitchell S | $157,874 |
Source: Public Records
Tax History Compared to Growth
Tax History
| Year | Tax Paid | Tax Assessment Tax Assessment Total Assessment is a certain percentage of the fair market value that is determined by local assessors to be the total taxable value of land and additions on the property. | Land | Improvement |
|---|---|---|---|---|
| 2024 | $4,569 | $106,463 | $14,161 | $92,302 |
| 2023 | $4,482 | $106,463 | $14,161 | $92,302 |
| 2022 | $4,371 | $83,651 | $11,358 | $72,293 |
| 2021 | $4,340 | $83,651 | $11,358 | $72,293 |
| 2020 | $4,278 | $83,651 | $11,358 | $72,293 |
| 2019 | $4,674 | $62,549 | $10,140 | $52,409 |
| 2018 | $3,164 | $62,549 | $10,140 | $52,409 |
| 2017 | $2,962 | $62,549 | $10,140 | $52,409 |
| 2016 | $3,058 | $64,019 | $11,078 | $52,941 |
| 2015 | $3,087 | $64,019 | $11,078 | $52,941 |
| 2014 | $3,098 | $64,019 | $11,078 | $52,941 |
| 2013 | $3,056 | $64,667 | $11,190 | $53,477 |
Source: Public Records
Map
Nearby Homes
- 3577 Mohler Rd
- 3490 Cooper Rd
- 3585 Fawnrun Dr
- 3662 Cooper Rd
- 103 Bentwood Ct
- 162 E Crest Dr
- 16 Carpenters Run
- 2590 Hunt Rd
- 9495 Reading Rd
- 1626 Krylon Dr
- 9481 Reading Rd
- 10301 Giverny Blvd
- 2259 Pompano Ave
- 109 Calico Ct
- 3590 Glendale Milford Rd
- 2800 Maple Tree Ct
- 234 Mcguire Ln
- 3756 Glendale Milford Rd
- 73 Orchard Knoll Dr
- 9870 Timbers Dr
- 3320 Plateau Place
- 3360 Plateau Place
- 3304 Plateau Place
- 3338 Plateau Place
- 3327 Twilight Dr
- 3303 Plateau Place
- 3309 Plateau Place
- 3280 Plateau Place
- 3321 Plateau Place
- 3333 Twilight Dr
- 3321 Twilight Dr
- 3350 Plateau Place
- 3335 Plateau Place
- 3281 Plateau Place
- 3281 Plateau Place
- 2981 Twilight Dr
- 3351 Plateau Place
- 3339 Twilight Dr
- 3270 Plateau Place
- 2983 Twilight Dr