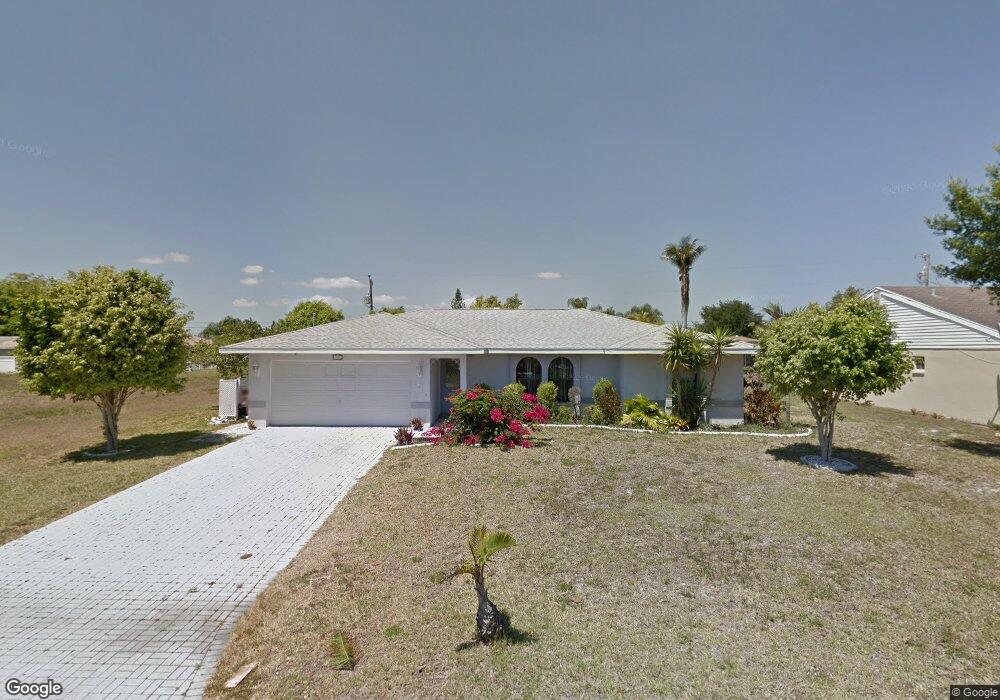
3310 SE 4th Place Cape Coral, FL 33904
Bimini Basin NeighborhoodEstimated Value: $324,221 - $422,000
3
Beds
2
Baths
1,917
Sq Ft
$185/Sq Ft
Est. Value
About This Home
This home is located at 3310 SE 4th Place, Cape Coral, FL 33904 and is currently estimated at $355,305, approximately $185 per square foot. 3310 SE 4th Place is a home located in Lee County with nearby schools including Cape Elementary School, Caloosa Elementary School, and Tropic Isles Elementary School.
Ownership History
Date
Name
Owned For
Owner Type
Purchase Details
Closed on
Jul 16, 2008
Sold by
Kroslack Kristie L
Bought by
Mendez Joseph W
Current Estimated Value
Home Financials for this Owner
Home Financials are based on the most recent Mortgage that was taken out on this home.
Original Mortgage
$167,275
Outstanding Balance
$107,695
Interest Rate
6.03%
Mortgage Type
FHA
Estimated Equity
$247,610
Purchase Details
Closed on
Oct 31, 2003
Sold by
Kroslack Joseph Frank
Bought by
Kroslack Kristie L
Purchase Details
Closed on
Jul 28, 2000
Purchase Details
Closed on
Apr 13, 2000
Sold by
Investments Inc
Bought by
Simmons Charles E
Purchase Details
Closed on
Mar 24, 2000
Sold by
Housing & Urban Development Washington D
Bought by
C J P Investments Inc
Purchase Details
Closed on
May 12, 1994
Sold by
Housing & Urban Dev
Bought by
Coleman Kenneth R and Coleman Melissa L
Home Financials for this Owner
Home Financials are based on the most recent Mortgage that was taken out on this home.
Original Mortgage
$77,403
Interest Rate
8.24%
Mortgage Type
FHA
Create a Home Valuation Report for This Property
The Home Valuation Report is an in-depth analysis detailing your home's value as well as a comparison with similar homes in the area
Home Values in the Area
Average Home Value in this Area
Purchase History
| Date | Buyer | Sale Price | Title Company |
|---|---|---|---|
| Mendez Joseph W | $169,900 | Pinnacle Title Company Inc | |
| Kroslack Kristie L | -- | -- | |
| -- | $122,500 | -- | |
| Simmons Charles E | $75,000 | -- | |
| C J P Investments Inc | -- | -- | |
| C J P Investments Inc | $85,700 | -- | |
| Coleman Kenneth R | $75,600 | -- |
Source: Public Records
Mortgage History
| Date | Status | Borrower | Loan Amount |
|---|---|---|---|
| Open | Mendez Joseph W | $167,275 | |
| Previous Owner | Coleman Kenneth R | $77,403 |
Source: Public Records
Tax History Compared to Growth
Tax History
| Year | Tax Paid | Tax Assessment Tax Assessment Total Assessment is a certain percentage of the fair market value that is determined by local assessors to be the total taxable value of land and additions on the property. | Land | Improvement |
|---|---|---|---|---|
| 2025 | $2,065 | $118,867 | -- | -- |
| 2024 | $1,933 | $115,517 | -- | -- |
| 2023 | $1,933 | $112,152 | $0 | $0 |
| 2022 | $1,743 | $108,885 | $0 | $0 |
| 2021 | $1,705 | $208,243 | $25,902 | $182,341 |
| 2020 | $1,699 | $104,254 | $0 | $0 |
| 2019 | $1,631 | $101,910 | $0 | $0 |
| 2018 | $1,611 | $100,010 | $0 | $0 |
| 2017 | $1,587 | $97,953 | $0 | $0 |
| 2016 | $1,528 | $151,493 | $21,372 | $130,121 |
| 2015 | $1,515 | $135,006 | $16,536 | $118,470 |
| 2014 | $1,458 | $131,093 | $14,944 | $116,149 |
| 2013 | -- | $111,292 | $10,892 | $100,400 |
Source: Public Records
Map
Nearby Homes
- 3401 SE 4th Place
- 407 SE 34th Terrace
- 3420 SE 5th Place
- 3928 SE 4th Ave
- 302 SE 34th St Unit 26
- 318 SE 33rd Terrace
- 3211 SE 4th Place
- 313 SE 33rd Terrace Unit 26
- 3208 SE 5th Ave
- 317 SE 32nd Terrace
- 3612 SE 5th Ave
- 3241 SE 1st Ct
- 3602 SE 2nd Ave
- 532 SE 36th St
- 3528 SE 1st Place
- 3209 SE 1st Ct
- 313 SE 31st Terrace
- 418 SE 31st St
- 3702 SE 6th Ave
- 502 SE 31st St
- 3306 SE 4th Place
- 3309 SE 4th Ave
- 3313 SE 4th Ave
- 3305 SE 4th Ave
- 3406 SE 4th Place
- 3302 SE 4th Place Unit 15
- 3309 SE 4th Place
- 3305 SE 4th Place
- 3403 SE 4th Ave
- 3301 SE 4th Ave
- 3410 SE 4th Place Unit 11
- 3405 SE 4th Place
- 3407 SE 4th Ave
- 343 SE 34th St
- 364 SE 33rd Terrace
- 411 SE 33rd Terrace
- 403 SE 34th Terrace
- 3416 SE 4th Place
- 407 SE 33rd Terrace
- 3411 SE 4th Ave