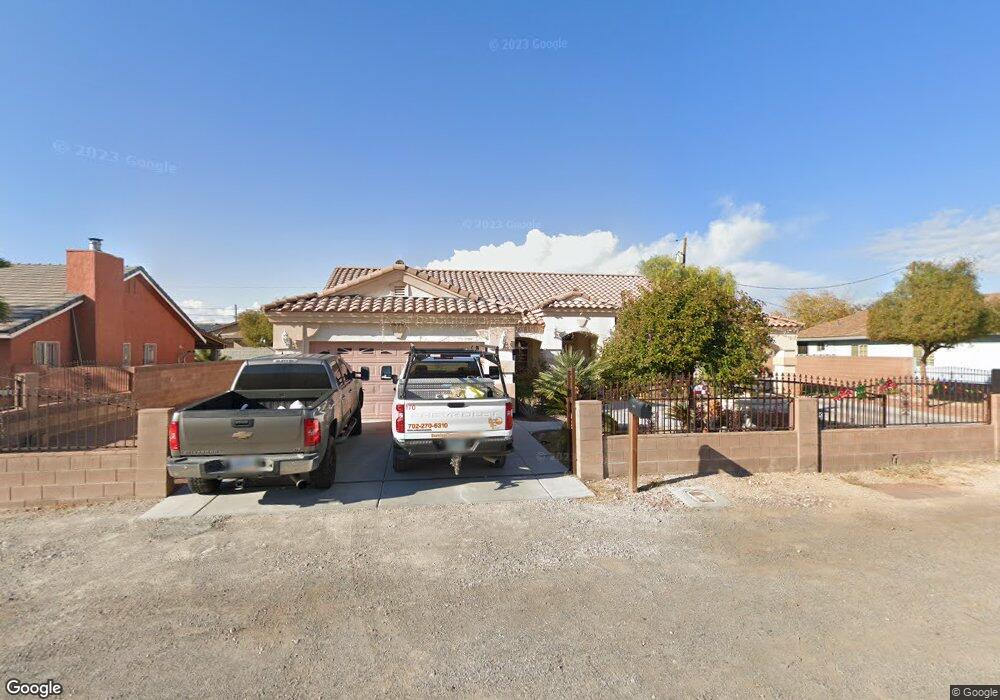
3311 Coleman St North Las Vegas, NV 89032
Cheyenne NeighborhoodEstimated Value: $435,000 - $459,000
4
Beds
2
Baths
2,028
Sq Ft
$222/Sq Ft
Est. Value
About This Home
This home is located at 3311 Coleman St, North Las Vegas, NV 89032 and is currently estimated at $450,323, approximately $222 per square foot. 3311 Coleman St is a home located in Clark County with nearby schools including Richard C. Priest Elementary School, Theron L Swainston Middle School, and Cheyenne High School.
Ownership History
Date
Name
Owned For
Owner Type
Purchase Details
Closed on
Feb 28, 2020
Sold by
Regalado Rene
Bought by
Esparza Jose Luis and Esparza Enedina
Current Estimated Value
Purchase Details
Closed on
Mar 12, 2013
Sold by
Murillo Martinez Ludivia
Bought by
Regalado Rene
Purchase Details
Closed on
May 2, 2011
Sold by
Esparza Jose and Esparza Enedina
Bought by
Regalado Rene and Murillo Martinez Ludivina
Home Financials for this Owner
Home Financials are based on the most recent Mortgage that was taken out on this home.
Original Mortgage
$100,000
Interest Rate
4.84%
Mortgage Type
New Conventional
Purchase Details
Closed on
Feb 23, 2001
Sold by
Esparza Jose and Esparza Ededina
Bought by
Esparza Jose and Esparza Enedina
Home Financials for this Owner
Home Financials are based on the most recent Mortgage that was taken out on this home.
Original Mortgage
$90,000
Interest Rate
6.98%
Create a Home Valuation Report for This Property
The Home Valuation Report is an in-depth analysis detailing your home's value as well as a comparison with similar homes in the area
Home Values in the Area
Average Home Value in this Area
Purchase History
| Date | Buyer | Sale Price | Title Company |
|---|---|---|---|
| Esparza Jose Luis | $248,500 | None Available | |
| Esparza Jose Luis | -- | None Available | |
| Regalado Rene | -- | None Available | |
| Regalado Rene | $125,000 | Nations Title Company Of Ne | |
| Esparza Jose | -- | Old Republic Title Company |
Source: Public Records
Mortgage History
| Date | Status | Borrower | Loan Amount |
|---|---|---|---|
| Previous Owner | Regalado Rene | $100,000 | |
| Previous Owner | Esparza Jose | $90,000 |
Source: Public Records
Tax History Compared to Growth
Tax History
| Year | Tax Paid | Tax Assessment Tax Assessment Total Assessment is a certain percentage of the fair market value that is determined by local assessors to be the total taxable value of land and additions on the property. | Land | Improvement |
|---|---|---|---|---|
| 2025 | $1,824 | $120,457 | $33,250 | $87,207 |
| 2024 | $1,771 | $120,457 | $33,250 | $87,207 |
| 2023 | $1,771 | $113,707 | $31,150 | $82,557 |
| 2022 | $1,720 | $100,086 | $24,500 | $75,586 |
| 2021 | $1,746 | $89,473 | $17,500 | $71,973 |
| 2020 | $1,618 | $86,911 | $15,750 | $71,161 |
| 2019 | $1,517 | $85,538 | $15,400 | $70,138 |
| 2018 | $1,447 | $80,590 | $12,950 | $67,640 |
| 2017 | $2,708 | $80,717 | $12,250 | $68,467 |
| 2016 | $1,356 | $62,270 | $12,250 | $50,020 |
| 2015 | $1,352 | $52,308 | $10,500 | $41,808 |
| 2014 | $1,310 | $74,482 | $7,000 | $67,482 |
Source: Public Records
Map
Nearby Homes
- 1981 Komodo Dragon Ct
- 0 N Ernest St
- 3440 Ernest St
- 3304 Simmons St
- 3355 Clayton St
- 3439 Cox St
- 3323 Outlook Point St
- 00 Ward
- 0 Clayton Unit 2712913
- 3834 W Gowan Rd
- 3524 Simmons St
- 2906 Carothers Ct
- 410 Rocky Peak Dr Unit 1704
- 3104 W Colton Ave Unit 1
- 1854 Oak Bluffs Ave
- 0 Simmons & Logan 3 Unit 2722103
- 1822 Trigger Way
- 0 June Unit 2706697
- 0 June Unit 2692591
- 0 Tamerind St Unit 2685915