Estimated Value: $217,000 - $239,000
--
Bed
2
Baths
1,404
Sq Ft
$162/Sq Ft
Est. Value
About This Home
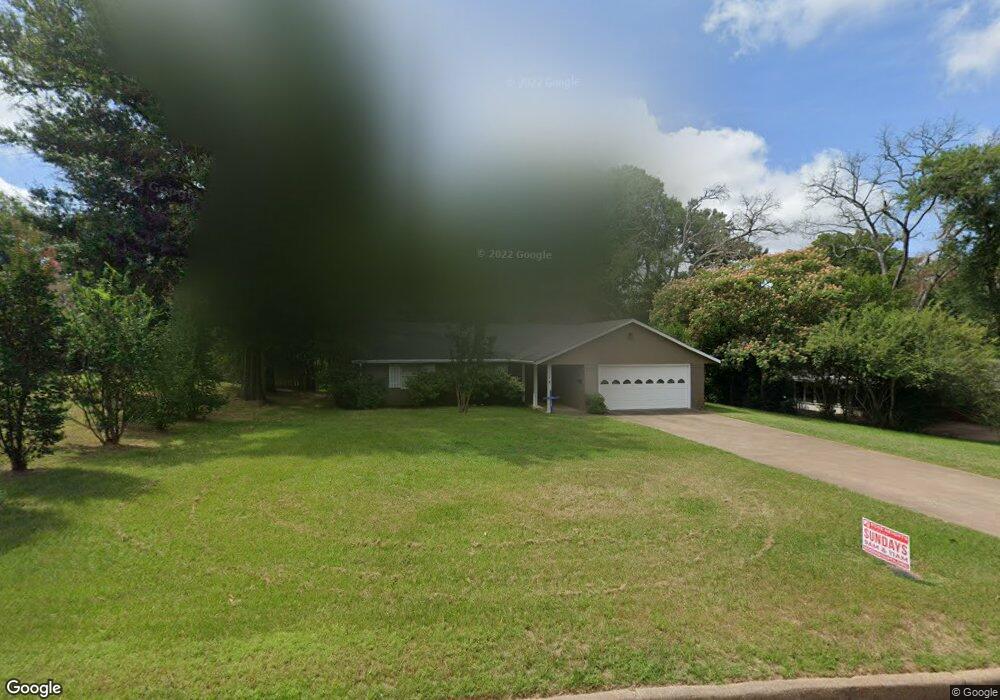
This home is located at 3311 Sandalwood Ln, Tyler, TX 75701 and is currently estimated at $227,152, approximately $161 per square foot. 3311 Sandalwood Ln is a home located in Smith County with nearby schools including Clarkston Elementary School, Hubbard Middle School, and Tyler Legacy High School.
Ownership History
Date
Name
Owned For
Owner Type
Purchase Details
Closed on
Oct 4, 2017
Sold by
Johnson Chance Clinton and Johnson Pam J
Bought by
Creasy Patricia
Current Estimated Value
Home Financials for this Owner
Home Financials are based on the most recent Mortgage that was taken out on this home.
Original Mortgage
$100,000
Outstanding Balance
$83,216
Interest Rate
3.86%
Mortgage Type
New Conventional
Estimated Equity
$143,936
Purchase Details
Closed on
Feb 8, 2012
Sold by
Anderson Charles E and Anderson Jennifer L
Bought by
Johnson Chance Clinton and Johnson Tim
Home Financials for this Owner
Home Financials are based on the most recent Mortgage that was taken out on this home.
Original Mortgage
$112,084
Interest Rate
4.4%
Mortgage Type
FHA
Purchase Details
Closed on
Jul 20, 2007
Sold by
Robertson Charles and Robertson Jana
Bought by
Anderson Charles E and Anderson Jennifer L
Home Financials for this Owner
Home Financials are based on the most recent Mortgage that was taken out on this home.
Original Mortgage
$106,875
Interest Rate
6.71%
Mortgage Type
Purchase Money Mortgage
Create a Home Valuation Report for This Property
The Home Valuation Report is an in-depth analysis detailing your home's value as well as a comparison with similar homes in the area
Home Values in the Area
Average Home Value in this Area
Purchase History
| Date | Buyer | Sale Price | Title Company |
|---|---|---|---|
| Creasy Patricia | -- | None Available | |
| Johnson Chance Clinton | -- | None Available | |
| Anderson Charles E | -- | None Available |
Source: Public Records
Mortgage History
| Date | Status | Borrower | Loan Amount |
|---|---|---|---|
| Open | Creasy Patricia | $100,000 | |
| Previous Owner | Johnson Chance Clinton | $112,084 | |
| Previous Owner | Anderson Charles E | $106,875 |
Source: Public Records
Tax History Compared to Growth
Tax History
| Year | Tax Paid | Tax Assessment Tax Assessment Total Assessment is a certain percentage of the fair market value that is determined by local assessors to be the total taxable value of land and additions on the property. | Land | Improvement |
|---|---|---|---|---|
| 2025 | $1,327 | $229,268 | $53,952 | $175,316 |
| 2024 | $1,327 | $201,714 | $40,740 | $177,477 |
| 2023 | $3,197 | $193,800 | $40,740 | $153,060 |
| 2022 | $3,266 | $166,705 | $33,523 | $133,182 |
| 2021 | $3,182 | $151,646 | $33,523 | $118,123 |
| 2020 | $3,103 | $144,990 | $33,523 | $111,467 |
| 2019 | $3,039 | $143,036 | $33,523 | $109,513 |
| 2018 | $2,748 | $126,362 | $23,280 | $103,082 |
| 2017 | $2,698 | $126,362 | $23,280 | $103,082 |
| 2016 | $2,576 | $120,681 | $23,280 | $97,401 |
| 2015 | $2,300 | $116,773 | $23,280 | $93,493 |
| 2014 | $2,300 | $113,698 | $23,280 | $90,418 |
Source: Public Records
Map
Nearby Homes
- 2216 Gish Ln
- 2033 Old Omen Rd
- 3205 Timberlane Dr
- 3027 Brentwood Dr
- 3401 Omega Dr
- 3014 Brentwood Dr
- 1835 Melba Dr
- 3020 Meadowlark Ln
- 2019 Woodhaven Dr
- 2936 Rollingwood Dr
- 3108 Williamsburg Cir
- 2110 Crestwood Dr
- 2613 Chelsea Dr
- 2523 Shenandoah Dr
- 2103 Crestwood Dr
- 2909 Meadowlark Ln
- 2527 Westminster Dr
- 3109 Campus Cir
- 2931 Meadow Brook Trail
- 1920 McDonald Rd
- 2200 2200 Brookhaven
- 3321 3321 Sandalwood Ln
- 2200 Brookhaven Dr
- 3321 Sandalwood Ln
- 3310 Brooks Ln
- 3300 Brooks Ln
- 3320 3320 Sandalwood
- 3320 Sandalwood Ln
- 3322 Brooks Ln
- 2134 Cottonwood Cir
- 2201 2201 Brookhaven
- 2201 Brookhaven Dr
- 2214 Old Omen Rd
- 2132 Cottonwood Cir
- 2218 Old Omen Rd
- 2221 Brookhaven Dr
- 2300 Brookhaven Dr
- 3311 3311 Brooks Ln
- 2125 Old Omen Rd
- 3311 Brooks Ln