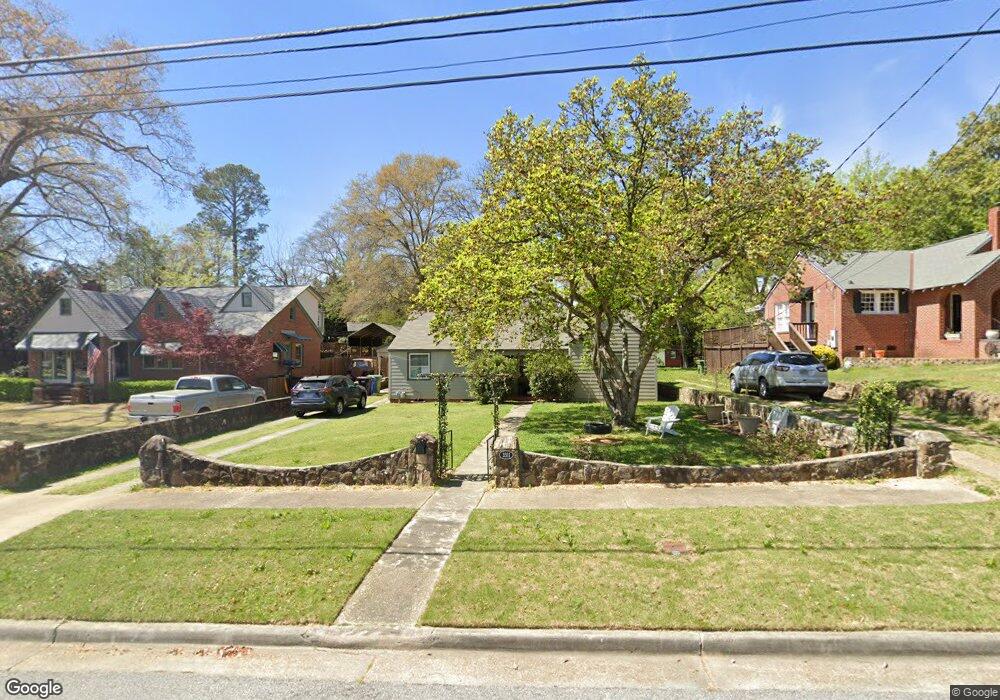
3311 Sherwood Ave Columbus, GA 31904
Estimated Value: $197,000 - $218,921
2
Beds
2
Baths
1,884
Sq Ft
$111/Sq Ft
Est. Value
About This Home
This home is located at 3311 Sherwood Ave, Columbus, GA 31904 and is currently estimated at $209,980, approximately $111 per square foot. 3311 Sherwood Ave is a home located in Muscogee County with nearby schools including Johnson Elementary School, Richards Middle School, and Jordan Vocational High School.
Ownership History
Date
Name
Owned For
Owner Type
Purchase Details
Closed on
Dec 30, 2008
Sold by
Scott Susan L and Scott James F
Bought by
Scott Jamie Faye
Current Estimated Value
Purchase Details
Closed on
Sep 22, 2008
Sold by
Jeff Holloway Properties Llc
Bought by
Scott Susan L and Scott James F
Home Financials for this Owner
Home Financials are based on the most recent Mortgage that was taken out on this home.
Original Mortgage
$84,455
Interest Rate
6.49%
Mortgage Type
Purchase Money Mortgage
Purchase Details
Closed on
Feb 29, 2008
Sold by
Snn Investments Llc
Bought by
Jeff Holloway Properties Llc
Home Financials for this Owner
Home Financials are based on the most recent Mortgage that was taken out on this home.
Original Mortgage
$65,500
Interest Rate
5.46%
Mortgage Type
Stand Alone First
Purchase Details
Closed on
Nov 5, 2007
Sold by
Nichols Susan N
Bought by
Snn Investments Llc
Create a Home Valuation Report for This Property
The Home Valuation Report is an in-depth analysis detailing your home's value as well as a comparison with similar homes in the area
Home Values in the Area
Average Home Value in this Area
Purchase History
| Date | Buyer | Sale Price | Title Company |
|---|---|---|---|
| Scott Jamie Faye | -- | None Available | |
| Scott Susan L | $88,900 | None Available | |
| Jeff Holloway Properties Llc | $58,500 | None Available | |
| Snn Investments Llc | -- | None Available |
Source: Public Records
Mortgage History
| Date | Status | Borrower | Loan Amount |
|---|---|---|---|
| Previous Owner | Scott Susan L | $84,455 | |
| Previous Owner | Jeff Holloway Properties Llc | $65,500 |
Source: Public Records
Tax History Compared to Growth
Tax History
| Year | Tax Paid | Tax Assessment Tax Assessment Total Assessment is a certain percentage of the fair market value that is determined by local assessors to be the total taxable value of land and additions on the property. | Land | Improvement |
|---|---|---|---|---|
| 2025 | $1,079 | $82,704 | $7,968 | $74,736 |
| 2024 | $1,078 | $82,704 | $7,968 | $74,736 |
| 2023 | $391 | $82,704 | $7,968 | $74,736 |
| 2022 | $1,124 | $52,832 | $7,968 | $44,864 |
| 2021 | $1,120 | $48,784 | $7,968 | $40,816 |
| 2020 | $1,118 | $48,784 | $7,968 | $40,816 |
| 2019 | $1,123 | $48,784 | $7,968 | $40,816 |
| 2018 | $1,123 | $48,784 | $7,968 | $40,816 |
| 2017 | $1,128 | $48,784 | $7,968 | $40,816 |
| 2016 | $1,134 | $40,754 | $2,716 | $38,038 |
| 2015 | $1,136 | $40,754 | $2,716 | $38,038 |
| 2014 | $1,138 | $40,754 | $2,716 | $38,038 |
| 2013 | -- | $40,754 | $2,716 | $38,038 |
Source: Public Records
Map
Nearby Homes
- 3105 Woodlawn Ave
- 3111 15th Ave
- 1810 Shannon Dr
- 1719 Slade Dr
- 3011 18th Ave
- 3305 Cherokee Ave
- 1310 31st St
- 3248 Cherokee Ave
- 3643 Calvin Dr
- 3030 13th Ave
- 1703 39th St
- 3232 Hillside Way
- 0 Warm Springs Rd
- 1209 31st St
- 1702 40th St
- 1918 Rosemont Dr
- 3905 Crestview Dr
- 1112 32nd St
- 1103 32nd St
- 2810 Pierpont Ave
- 3307 Sherwood Ave
- 3315 Sherwood Ave
- 3319 Sherwood Ave
- 3303 Sherwood Ave
- 3304 Woodlawn Ave
- 3302 Woodlawn Ave
- 3308 Woodlawn Ave
- 3300 Woodlawn Ave
- 3401 Sherwood Ave
- 3219 Sherwood Ave
- 3316 Woodlawn Ave
- 3214 Woodlawn Ave
- 3314 Sherwood Ave
- 3306 Sherwood Ave
- 3302 Sherwood Ave
- 3320 Woodlawn Ave
- 3318 Sherwood Ave
- 3407 Sherwood Ave
- 3300 Sherwood Ave
- 3400 Sherwood Ave