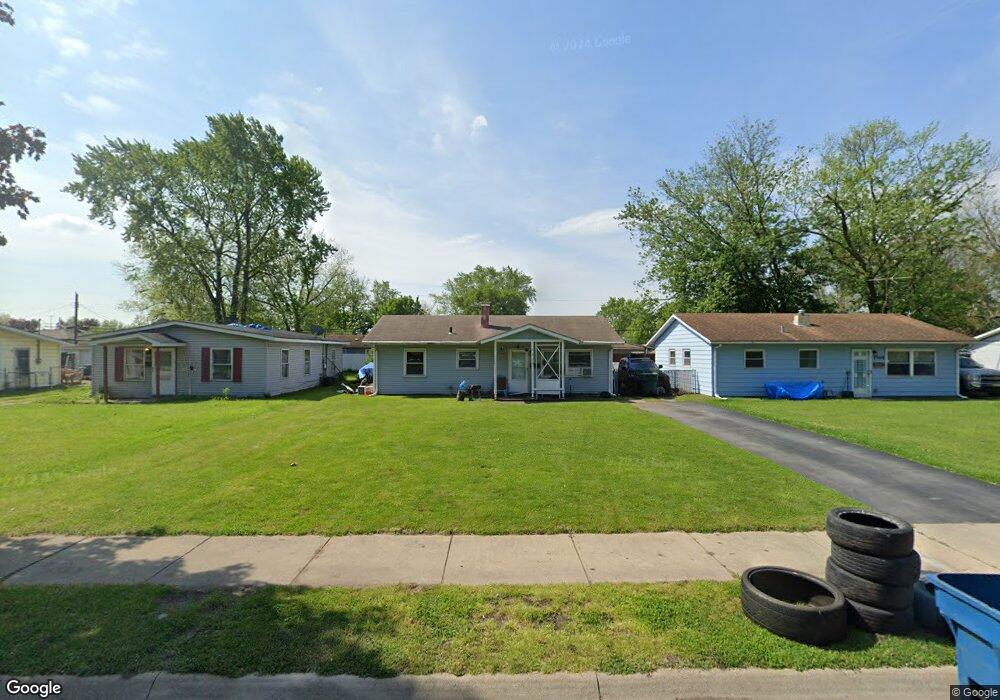
3312 175th Place Hammond, IN 46323
Hessville NeighborhoodEstimated Value: $141,000 - $172,000
3
Beds
1
Bath
888
Sq Ft
$184/Sq Ft
Est. Value
About This Home
This home is located at 3312 175th Place, Hammond, IN 46323 and is currently estimated at $163,023, approximately $183 per square foot. 3312 175th Place is a home located in Lake County with nearby schools including Joseph Hess Elementary School, Charles N Scott Middle School, and Morton Senior High School.
Ownership History
Date
Name
Owned For
Owner Type
Purchase Details
Closed on
May 26, 2022
Sold by
Deanna Strickland
Bought by
Strickland Donald William and Strickland Deanna
Current Estimated Value
Purchase Details
Closed on
Apr 19, 2022
Sold by
Strickland Deanna S
Bought by
Strickland Donald William and Strickland Deanna S
Purchase Details
Closed on
Mar 18, 2022
Sold by
Strickland Deanna S
Bought by
Strickland Donald William and Strickland Deanna S
Purchase Details
Closed on
Aug 3, 2017
Sold by
Southpark Inc
Bought by
Hammond Redevelopment Commission
Purchase Details
Closed on
Sep 27, 2016
Sold by
Stricklend George W
Bought by
Strickland Deanna
Purchase Details
Closed on
Aug 4, 2016
Sold by
Stricklnd George
Bought by
Strickland Denna
Purchase Details
Closed on
Mar 21, 2014
Sold by
Strickland George W and Estate Of Vivian J Holliway
Bought by
Strickland George W
Create a Home Valuation Report for This Property
The Home Valuation Report is an in-depth analysis detailing your home's value as well as a comparison with similar homes in the area
Home Values in the Area
Average Home Value in this Area
Purchase History
| Date | Buyer | Sale Price | Title Company |
|---|---|---|---|
| Strickland Donald William | -- | None Listed On Document | |
| Strickland Donald William | -- | None Listed On Document | |
| Strickland Donald William | -- | None Listed On Document | |
| Hammond Redevelopment Commission | -- | Chicago Title Ins Co | |
| Strickland Deanna | -- | None Available | |
| Strickland Denna | -- | None Available | |
| Strickland George W | -- | None Available |
Source: Public Records
Tax History Compared to Growth
Tax History
| Year | Tax Paid | Tax Assessment Tax Assessment Total Assessment is a certain percentage of the fair market value that is determined by local assessors to be the total taxable value of land and additions on the property. | Land | Improvement |
|---|---|---|---|---|
| 2024 | $4,598 | $104,200 | $24,500 | $79,700 |
| 2023 | $2,607 | $96,200 | $24,500 | $71,700 |
| 2022 | $2,607 | $97,300 | $24,500 | $72,800 |
| 2021 | $2,214 | $81,700 | $15,300 | $66,400 |
| 2020 | $1,916 | $70,200 | $15,300 | $54,900 |
| 2019 | $1,977 | $66,500 | $15,300 | $51,200 |
| 2018 | $2,099 | $65,100 | $15,300 | $49,800 |
| 2017 | $2,329 | $63,200 | $15,300 | $47,900 |
| 2016 | $1,998 | $62,500 | $15,300 | $47,200 |
| 2014 | -- | $55,200 | $15,300 | $39,900 |
| 2013 | -- | $55,200 | $15,300 | $39,900 |
Source: Public Records
Map
Nearby Homes
- 3315 176th St
- 3230 176th St
- 3548 174th Place
- 7341 Grand Ave
- 7352 Nebraska Ave
- 7207 Parrish Ave
- 7339 California Ave
- 3704 175th Place
- 7216 Montana Ave
- 3718 173rd Ct
- 7137 Delaware Ave
- 7109 Parrish Ave Unit 11
- 7620 New Hampshire Ave
- 7130 Grand Ave
- 2945 Orchard Dr
- 7120 Grand Ave
- 7125 Grand Ave
- 3318 North Dr
- 3534 170th Place
- 7527 Marshall Ave
- 3316 175th Place
- 3308 175th Place
- 3320 175th Place
- 3304 175th Place
- 3311 176th St
- 3307 176th St
- 3324 175th Place
- 3252 175th Place
- 3303 176th St
- 3319 176th St
- 3311 175th Place
- 3315 175th Place
- 3307 175th Place
- 3323 176th St
- 3301 176th St
- 3328 175th Place
- 3319 175th Place
- 3303 175th Place
- 3248 175th Place
- 3323 175th Place