3312 Knox St Columbus, GA 31903
South Columbus NeighborhoodEstimated Value: $49,887 - $82,000
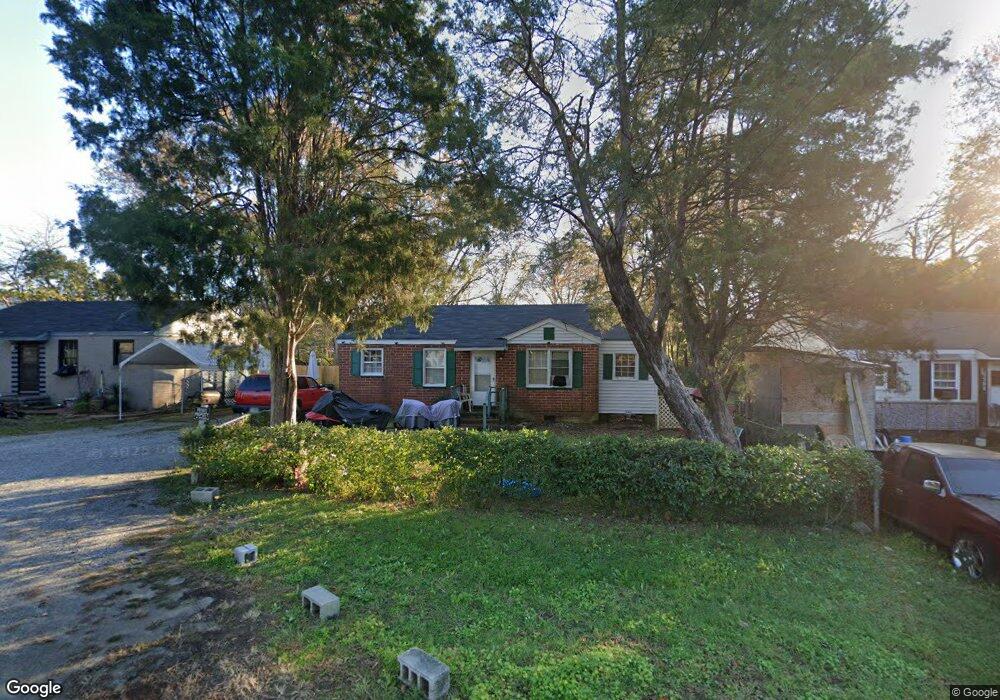
About This Home
This home is located at 3312 Knox St, Columbus, GA 31903 and is currently estimated at $61,222, approximately $64 per square foot. 3312 Knox St is a home located in Muscogee County with nearby schools including South Columbus Elementary School, Eddy Middle School, and Spencer High School.
Ownership History
We collect this data history from publicly available records. To have your information removed, we recommend requesting removal directly through your county’s website.
Purchase Details
Home Financials for this Owner
Home Financials are based on the most recent Mortgage that was taken out on this home.Purchase Details
Home Values in the Area
Average Home Value in this Area
Purchase History
We collect this data history from publicly available records. To have your information removed, we recommend requesting removal directly through your county’s website.
| Date | Buyer | Sale Price | Title Company |
|---|---|---|---|
| $36,000 | -- | ||
| $21,500 | -- |
Mortgage History
We collect this data history from publicly available records. To have your information removed, we recommend requesting removal directly through your county’s website.
| Date | Status | Borrower | Loan Amount |
|---|---|---|---|
| Open | $34,000 |
Tax History
We collect this data history from publicly available records. To have your information removed, we recommend requesting removal directly through your county’s website.
| Year | Tax Paid | Tax Assessment Tax Assessment Total Assessment is a certain percentage of the fair market value that is determined by local assessors to be the total taxable value of land and additions on the property. | Land | Improvement |
|---|---|---|---|---|
| 2025 | $525 | $13,424 | $3,352 | $10,072 |
| 2024 | $525 | $13,424 | $3,352 | $10,072 |
| 2023 | $529 | $13,424 | $3,352 | $10,072 |
| 2022 | $383 | $9,392 | $3,352 | $6,040 |
| 2021 | $336 | $8,228 | $3,352 | $4,876 |
| 2020 | $336 | $8,228 | $3,352 | $4,876 |
| 2019 | $337 | $8,228 | $3,352 | $4,876 |
| 2018 | $337 | $8,228 | $3,352 | $4,876 |
| 2017 | $586 | $14,252 | $4,192 | $10,060 |
| 2016 | $451 | $10,944 | $1,788 | $9,156 |
| 2015 | $181 | $10,944 | $1,788 | $9,156 |
| 2014 | $181 | $10,944 | $1,788 | $9,156 |
| 2013 | -- | $10,944 | $1,788 | $9,156 |
Map
- 2343 Manning Ave
- 2333 Bruce Ave
- 3233 Hendrix St
- 3120 Drake St
- 1601 Lumpkin Rd
- 41 Ticknor Dr
- 3063 Meade St
- 58 Ticknor Dr
- 2237 Ticknor Dr
- 122 Torch Hill Rd
- 2002 Somerset Ave
- 3015 Blan St
- 3015 Hendrix St
- 3023 Colonial Dr
- 41 Mason Dr
- 2940 Blan St
- 52 Mathews St
- 1601 S Lumpkin Rd
- 3433 Marathon Dr
- 2848 Blan St
Ask me questions while you tour the home.