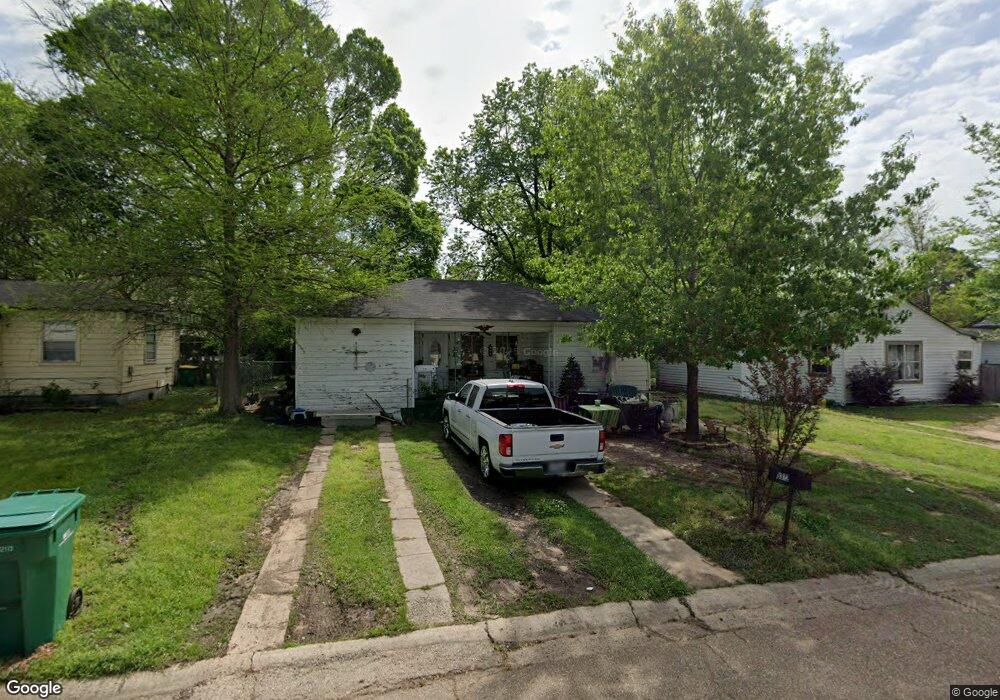
3312 Moore Dr Texarkana, TX 75503
Estimated Value: $76,000 - $95,000
--
Bed
--
Bath
1,019
Sq Ft
$84/Sq Ft
Est. Value
About This Home
This home is located at 3312 Moore Dr, Texarkana, TX 75503 and is currently estimated at $86,103, approximately $84 per square foot. 3312 Moore Dr is a home located in Bowie County with nearby schools including Highland Park Elementary School, Texas Middle School, and Texas High School.
Ownership History
Date
Name
Owned For
Owner Type
Purchase Details
Closed on
Oct 19, 2021
Sold by
Tnt Properties Of Texarkana Llc
Bought by
Borrego Pedro and Cruz Silvia
Current Estimated Value
Purchase Details
Closed on
May 10, 2006
Sold by
Secretary Of Hud
Bought by
Turner Donald R
Home Financials for this Owner
Home Financials are based on the most recent Mortgage that was taken out on this home.
Original Mortgage
$23,760
Interest Rate
6.36%
Create a Home Valuation Report for This Property
The Home Valuation Report is an in-depth analysis detailing your home's value as well as a comparison with similar homes in the area
Home Values in the Area
Average Home Value in this Area
Purchase History
| Date | Buyer | Sale Price | Title Company |
|---|---|---|---|
| Borrego Pedro | -- | None Listed On Document | |
| Turner Donald R | -- | None Available |
Source: Public Records
Mortgage History
| Date | Status | Borrower | Loan Amount |
|---|---|---|---|
| Previous Owner | Turner Donald R | $23,760 |
Source: Public Records
Tax History Compared to Growth
Tax History
| Year | Tax Paid | Tax Assessment Tax Assessment Total Assessment is a certain percentage of the fair market value that is determined by local assessors to be the total taxable value of land and additions on the property. | Land | Improvement |
|---|---|---|---|---|
| 2025 | $1,022 | $44,632 | $6,500 | $38,132 |
| 2024 | $1,022 | $43,173 | $6,500 | $36,673 |
| 2023 | $958 | $40,458 | $6,500 | $33,958 |
| 2022 | $879 | $36,822 | $6,500 | $30,322 |
| 2021 | $869 | $33,997 | $6,500 | $27,497 |
| 2020 | $840 | $32,689 | $6,500 | $26,189 |
| 2019 | $839 | $31,444 | $6,500 | $24,944 |
| 2018 | $813 | $30,482 | $6,500 | $23,982 |
| 2017 | $798 | $30,015 | $6,500 | $23,515 |
| 2016 | $780 | $29,329 | $6,500 | $22,829 |
| 2015 | $801 | $29,107 | $6,500 | $22,607 |
| 2014 | $801 | $30,956 | $6,500 | $24,456 |
Source: Public Records
Map
Nearby Homes