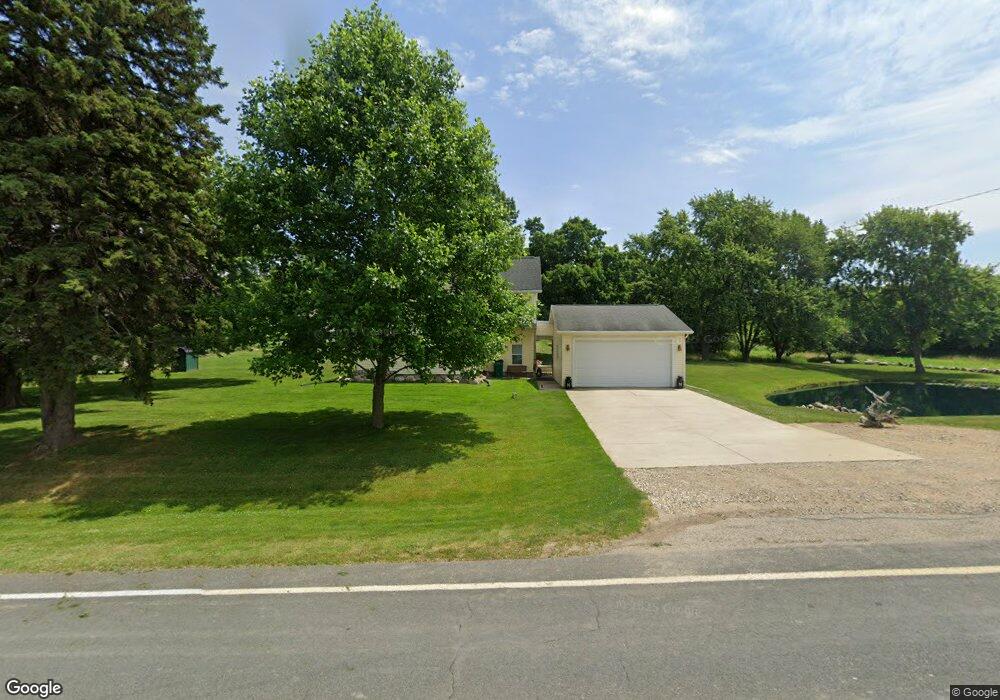
3313 18th St Hopkins, MI 49328
Estimated Value: $646,000
3
Beds
1
Bath
3,332
Sq Ft
$194/Sq Ft
Est. Value
About This Home
This home is located at 3313 18th St, Hopkins, MI 49328 and is currently estimated at $646,000, approximately $193 per square foot. 3313 18th St is a home located in Allegan County with nearby schools including Hopkins High School and St. Stanislaus School.
Ownership History
Date
Name
Owned For
Owner Type
Purchase Details
Closed on
Jul 26, 2000
Bought by
Niemczyk Paul and Niemczyk Melodie
Current Estimated Value
Purchase Details
Closed on
Jul 17, 2000
Bought by
Niemczyk Paul and Niemczyk Melodie
Purchase Details
Closed on
Jul 18, 1995
Sold by
Niemczyk Evelyn
Bought by
Niemczyk Evelyn Trust
Create a Home Valuation Report for This Property
The Home Valuation Report is an in-depth analysis detailing your home's value as well as a comparison with similar homes in the area
Home Values in the Area
Average Home Value in this Area
Purchase History
| Date | Buyer | Sale Price | Title Company |
|---|---|---|---|
| Niemczyk Paul | $180,000 | -- | |
| Niemczyk Paul | $180,000 | -- | |
| Niemczyk Evelyn Trust | -- | -- |
Source: Public Records
Tax History Compared to Growth
Tax History
| Year | Tax Paid | Tax Assessment Tax Assessment Total Assessment is a certain percentage of the fair market value that is determined by local assessors to be the total taxable value of land and additions on the property. | Land | Improvement |
|---|---|---|---|---|
| 2025 | $3,490 | $368,300 | $185,200 | $183,100 |
| 2024 | $3,032 | $315,000 | $141,000 | $174,000 |
| 2023 | $3,032 | $280,900 | $130,200 | $150,700 |
| 2022 | $3,032 | $234,100 | $110,500 | $123,600 |
| 2021 | $2,935 | $234,600 | $114,600 | $120,000 |
| 2020 | $2,935 | $239,400 | $115,800 | $123,600 |
| 2019 | $0 | $225,000 | $109,500 | $115,500 |
| 2018 | $0 | $216,000 | $109,500 | $106,500 |
| 2017 | $0 | $201,200 | $99,100 | $102,100 |
| 2016 | $0 | $190,100 | $96,000 | $94,100 |
| 2015 | -- | $190,100 | $96,000 | $94,100 |
| 2014 | -- | $186,200 | $96,800 | $89,400 |
| 2013 | -- | $180,100 | $94,500 | $85,600 |
Source: Public Records
Map
Nearby Homes
- 2037 128th Ave
- 3778 22nd St
- 4674 12th St
- 326 Grant St
- 407 Selby St
- 1659 Creek Side Ct
- 416 Mankin St
- 1149 Regina Trail
- 2298 138th Ave
- 1143 Regina Trail
- 3570 Windsor Woods Dr
- 319 Alpine St
- 219 Alpine St
- 2371 Maple Lane Ave
- 4087 Ronalds Rd
- 3610 Garden St
- 4101 White Pine Dr Unit 4
- 621 S Main St
- 110 E Sycamore St
- 545 N Main St