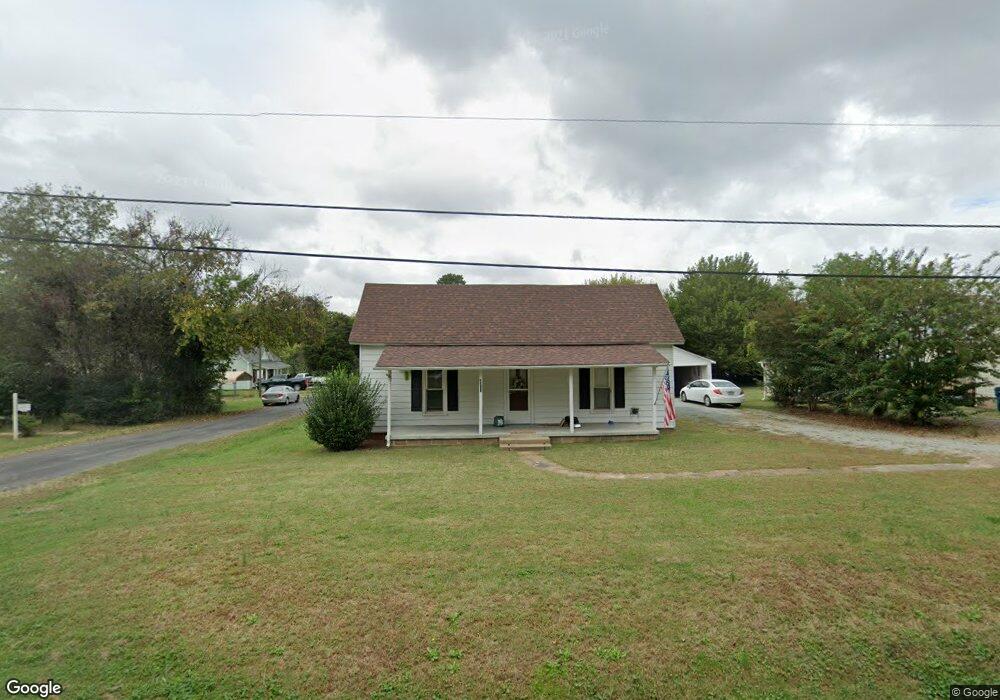
3313 Forrest Ave Efland, NC 27243
Estimated Value: $159,000 - $299,000
2
Beds
1
Bath
1,636
Sq Ft
$139/Sq Ft
Est. Value
About This Home
This home is located at 3313 Forrest Ave, Efland, NC 27243 and is currently estimated at $227,777, approximately $139 per square foot. 3313 Forrest Ave is a home located in Orange County with nearby schools including Efland Cheeks Elementary School, Gravelly Hill Middle, and The Expedition School.
Ownership History
Date
Name
Owned For
Owner Type
Purchase Details
Closed on
Mar 4, 2022
Sold by
Monroe Cates Earl and Monroe Marie Katie
Bought by
Cates Earl Monroe and Duffy Katie Marie
Current Estimated Value
Home Financials for this Owner
Home Financials are based on the most recent Mortgage that was taken out on this home.
Original Mortgage
$146,250
Outstanding Balance
$136,032
Interest Rate
3.69%
Mortgage Type
New Conventional
Estimated Equity
$91,745
Purchase Details
Closed on
Sep 25, 2020
Sold by
Glasgow Mary Jane and Glasgow Marvis Gray
Bought by
Cates Earl Monroe
Home Financials for this Owner
Home Financials are based on the most recent Mortgage that was taken out on this home.
Original Mortgage
$50,000
Interest Rate
2.9%
Mortgage Type
Seller Take Back
Purchase Details
Closed on
Sep 8, 2003
Sold by
Sykes Martha Jane C
Bought by
Glasgow Mary Jane Sykes
Create a Home Valuation Report for This Property
The Home Valuation Report is an in-depth analysis detailing your home's value as well as a comparison with similar homes in the area
Home Values in the Area
Average Home Value in this Area
Purchase History
| Date | Buyer | Sale Price | Title Company |
|---|---|---|---|
| Cates Earl Monroe | -- | Kelso Lloyd T | |
| Cates Earl Monroe | -- | None Listed On Document | |
| Cates Earl Monroe | $70,000 | None Available | |
| Glasgow Mary Jane Sykes | -- | -- |
Source: Public Records
Mortgage History
| Date | Status | Borrower | Loan Amount |
|---|---|---|---|
| Open | Cates Earl Monroe | $146,250 | |
| Closed | Cates Earl Monroe | $146,250 | |
| Previous Owner | Cates Earl Monroe | $50,000 |
Source: Public Records
Tax History Compared to Growth
Tax History
| Year | Tax Paid | Tax Assessment Tax Assessment Total Assessment is a certain percentage of the fair market value that is determined by local assessors to be the total taxable value of land and additions on the property. | Land | Improvement |
|---|---|---|---|---|
| 2025 | $1,297 | $160,500 | $20,200 | $140,300 |
| 2024 | $1,334 | $123,800 | $13,000 | $110,800 |
| 2023 | $1,303 | $123,800 | $13,000 | $110,800 |
| 2022 | $1,420 | $138,900 | $0 | $138,900 |
| 2021 | $1,388 | $139,800 | $29,000 | $110,800 |
| 2020 | $1,250 | $118,400 | $25,500 | $92,900 |
| 2018 | $1,219 | $118,400 | $25,500 | $92,900 |
| 2017 | $944 | $118,400 | $25,500 | $92,900 |
| 2016 | $944 | $88,283 | $18,911 | $69,372 |
| 2015 | $944 | $88,283 | $18,911 | $69,372 |
| 2014 | $924 | $88,283 | $18,911 | $69,372 |
Source: Public Records
Map
Nearby Homes
- 321 Efland Cedar Grove Rd
- 3605 W Ten Rd
- Lot 4 Harding St
- 413 Chadwick Ln
- 0 Olivia Pope Way
- 0000 Olivia Pope Way
- 1115 Sepelo Way
- 4620 Timberwood Trail Unit 27243
- 0 Mirandy Ave
- 1455 Dimmocks Mill Rd
- 1021 Dimmocks Mill Rd
- 2201 Moorefields Rd
- 423 Orange Heights Loop Rd
- 711 Kentcie Ln
- 301 W Hill Ave S
- 105 Sherwood Ln
- 106 Sherwood Ln
- 224 Holiday Park Rd
- 101 Jones Ave
- 109 Jones Ave