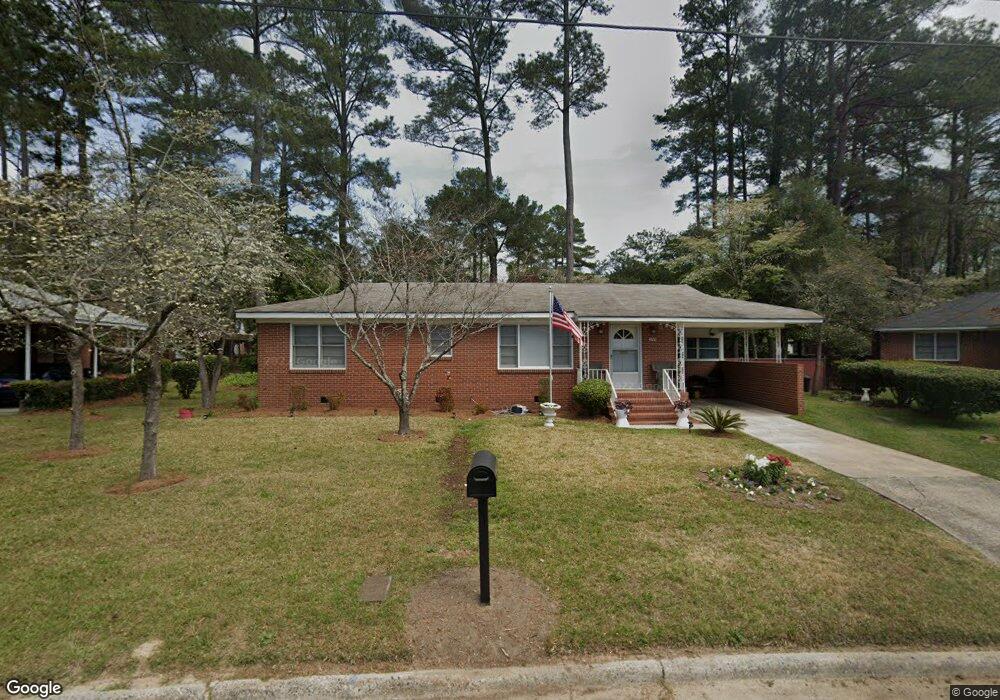
3313 Hallwood Cir Macon, GA 31204
Estimated Value: $90,000 - $104,000
3
Beds
1
Bath
1,183
Sq Ft
$80/Sq Ft
Est. Value
About This Home
This home is located at 3313 Hallwood Cir, Macon, GA 31204 and is currently estimated at $95,113, approximately $80 per square foot. 3313 Hallwood Cir is a home located in Bibb County with nearby schools including John Robert Lewis Elementary School, Weaver Middle School, and Westside High School.
Ownership History
Date
Name
Owned For
Owner Type
Purchase Details
Closed on
Oct 17, 2024
Sold by
Sheffield Pierce Daniels
Bought by
Robinson Sheridan C
Current Estimated Value
Home Financials for this Owner
Home Financials are based on the most recent Mortgage that was taken out on this home.
Original Mortgage
$83,460
Outstanding Balance
$81,319
Interest Rate
6.35%
Mortgage Type
FHA
Estimated Equity
$13,794
Purchase Details
Closed on
Jun 13, 2023
Sold by
Sheffield Investment Properties Llc
Bought by
Jenkins Elizabeth Rachel and Sheffield Pierce Daniels
Purchase Details
Closed on
Nov 1, 2019
Sold by
Sheffield Pierce Daniels
Bought by
Sheffield Investment Properties Llc
Purchase Details
Closed on
Oct 30, 2019
Sold by
Sheffield Pierce Daniels
Bought by
Sheffield Pierce Daniels
Purchase Details
Closed on
Jun 26, 1962
Sold by
Valdez Gilbert and Valdez Shirley E
Bought by
Rumble Johnnie Ruth
Create a Home Valuation Report for This Property
The Home Valuation Report is an in-depth analysis detailing your home's value as well as a comparison with similar homes in the area
Home Values in the Area
Average Home Value in this Area
Purchase History
| Date | Buyer | Sale Price | Title Company |
|---|---|---|---|
| Robinson Sheridan C | $85,000 | None Listed On Document | |
| Jenkins Elizabeth Rachel | -- | None Listed On Document | |
| Sheffield Investment Properties Llc | -- | None Available | |
| Sheffield Pierce Daniels | -- | None Available | |
| Rumble Johnnie Ruth | $1,000 | -- |
Source: Public Records
Mortgage History
| Date | Status | Borrower | Loan Amount |
|---|---|---|---|
| Open | Robinson Sheridan C | $83,460 |
Source: Public Records
Tax History Compared to Growth
Tax History
| Year | Tax Paid | Tax Assessment Tax Assessment Total Assessment is a certain percentage of the fair market value that is determined by local assessors to be the total taxable value of land and additions on the property. | Land | Improvement |
|---|---|---|---|---|
| 2025 | $791 | $32,184 | $2,280 | $29,904 |
| 2024 | $658 | $25,892 | $2,280 | $23,612 |
| 2023 | $767 | $25,892 | $2,280 | $23,612 |
| 2022 | $1,033 | $29,837 | $3,823 | $26,014 |
| 2021 | $867 | $22,825 | $3,186 | $19,639 |
| 2020 | $886 | $22,825 | $3,186 | $19,639 |
| 2019 | $894 | $22,825 | $3,186 | $19,639 |
| 2018 | $1,556 | $22,952 | $3,186 | $19,766 |
| 2017 | $860 | $22,952 | $3,186 | $19,766 |
| 2016 | $794 | $22,952 | $3,186 | $19,766 |
| 2015 | $1,124 | $22,952 | $3,186 | $19,766 |
| 2014 | $431 | $22,952 | $3,186 | $19,766 |
Source: Public Records
Map
Nearby Homes
- 3321 Hallwood Cir
- 1224 Carlisle Ave
- 1228 Carlisle Ave
- 3301 Hallwood Cir
- 1232 Carlisle Ave
- 3300 Hallwood Cir
- 1220 Carlisle Ave
- 3327 Hallwood Cir
- 3295 Hallwood Cir
- 1236 Carlisle Ave
- 3308 Hallwood Cir
- 3292 Hallwood Cir
- 1216 Carlisle Ave
- 1216 Carlisle Ave
- 3289 Hallwood Cir
- 1240 Carlisle Ave
- 3320 Hallwood Cir
- 1271 Mimosa Dr
- 1259 Mimosa Dr
- 3333 Hallwood Cir