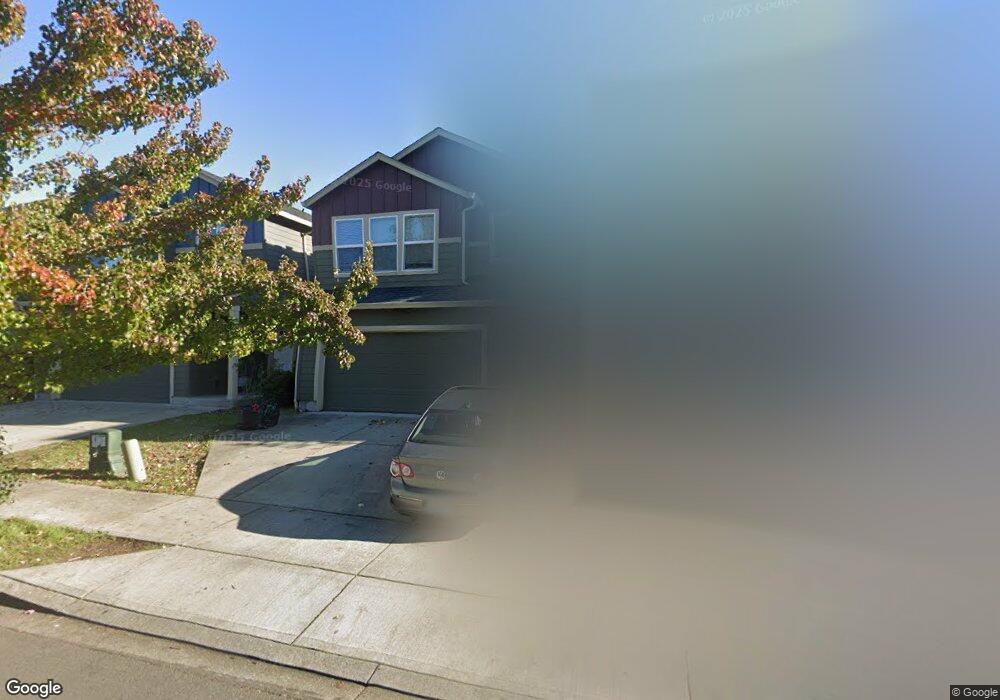
3313 NE 43rd Place Unit BM 31 Vancouver, WA 98661
Bagley Downs NeighborhoodEstimated Value: $417,000 - $429,000
3
Beds
3
Baths
1,574
Sq Ft
$269/Sq Ft
Est. Value
About This Home
This home is located at 3313 NE 43rd Place Unit BM 31, Vancouver, WA 98661 and is currently estimated at $423,992, approximately $269 per square foot. 3313 NE 43rd Place Unit BM 31 is a home located in Clark County with nearby schools including Roosevelt Elementary School, McLoughlin Middle School, and Fort Vancouver High School.
Ownership History
Date
Name
Owned For
Owner Type
Purchase Details
Closed on
Sep 16, 2011
Sold by
Manor Homes Washington Inc
Bought by
White Deborah Renee
Current Estimated Value
Home Financials for this Owner
Home Financials are based on the most recent Mortgage that was taken out on this home.
Original Mortgage
$122,560
Outstanding Balance
$83,928
Interest Rate
4.26%
Mortgage Type
New Conventional
Estimated Equity
$340,064
Purchase Details
Closed on
Jun 29, 2011
Sold by
Riverview Community Bank
Bought by
Manor Homes Washington Inc
Home Financials for this Owner
Home Financials are based on the most recent Mortgage that was taken out on this home.
Original Mortgage
$92,600
Interest Rate
4.45%
Mortgage Type
Purchase Money Mortgage
Purchase Details
Closed on
Jul 26, 2010
Sold by
Palace Construction Corp
Bought by
Riverview Community Bank
Create a Home Valuation Report for This Property
The Home Valuation Report is an in-depth analysis detailing your home's value as well as a comparison with similar homes in the area
Home Values in the Area
Average Home Value in this Area
Purchase History
| Date | Buyer | Sale Price | Title Company |
|---|---|---|---|
| White Deborah Renee | $163,414 | Fidelity National Title | |
| Manor Homes Washington Inc | $32,000 | Fidelity National Title | |
| Riverview Community Bank | $1,100,000 | Clark County Title Co |
Source: Public Records
Mortgage History
| Date | Status | Borrower | Loan Amount |
|---|---|---|---|
| Open | White Deborah Renee | $122,560 | |
| Previous Owner | Manor Homes Washington Inc | $92,600 |
Source: Public Records
Tax History Compared to Growth
Tax History
| Year | Tax Paid | Tax Assessment Tax Assessment Total Assessment is a certain percentage of the fair market value that is determined by local assessors to be the total taxable value of land and additions on the property. | Land | Improvement |
|---|---|---|---|---|
| 2025 | $4,039 | $402,147 | $133,325 | $268,822 |
| 2024 | $3,841 | $413,487 | $133,325 | $280,162 |
| 2023 | $3,629 | $410,441 | $133,325 | $277,116 |
| 2022 | $3,322 | $389,360 | $133,325 | $256,035 |
| 2021 | $2,972 | $332,058 | $112,500 | $219,558 |
| 2020 | $2,726 | $279,989 | $71,750 | $208,239 |
| 2019 | $2,685 | $266,109 | $61,850 | $204,259 |
| 2018 | $2,676 | $271,497 | $0 | $0 |
| 2017 | $2,444 | $224,637 | $0 | $0 |
| 2016 | $2,262 | $214,075 | $0 | $0 |
| 2015 | $2,270 | $189,319 | $0 | $0 |
| 2014 | -- | $179,640 | $0 | $0 |
| 2013 | -- | $167,236 | $0 | $0 |
Source: Public Records
Map
Nearby Homes
- 5505 NE 43rd Place
- 3306 NE 43rd Place
- 4456 NE Nicholson Loop
- 3317 Falk Rd
- 3917 NE 35th Cir
- 0 NE 38th St Unit 14 351274999
- 0 NE 38th St Unit 20 110815407
- 0 NE 38th St Unit 19 708684594
- 0 NE 38th St Unit 21 331125690
- 0 NE 38th St Unit 15 380111173
- 4311 Plomondon St
- 0 Falk Rd
- 4508 NE 41st St
- 3605 NE 38th St
- 5301 Plomondon St Unit F24
- 4505 NE 44th St
- 2727 Rossiter Ln
- 5415 NE 34th St Unit C
- 5417 NE 34th St Unit 30(H)
- 13 Algona Dr
- 3313 NE 43rd Place
- 3315 NE 43rd Place
- 3311 NE 43rd Place
- 4303 NE 34th Cir
- 3309 NE 43rd Place
- 4576 NE Nicholson Loop
- 4574 NE Nicholson Loop
- 3307 NE 43rd Place
- 4572 NE Nicholson Loop
- 4482 NE Nicholson Loop
- 4309 NE 34th Cir
- 3312 NE 43rd Place
- 3312 NE 43rd Place Unit BM 43
- 3310 NE 43rd Place
- 4484 NE Nicholson Loop
- 3314 NE 43rd Place
- 4570 NE Nicholson Loop
- 3305 NE 43rd Place
- 3308 NE 43rd Place
- 4486 NE Nicholson Loop