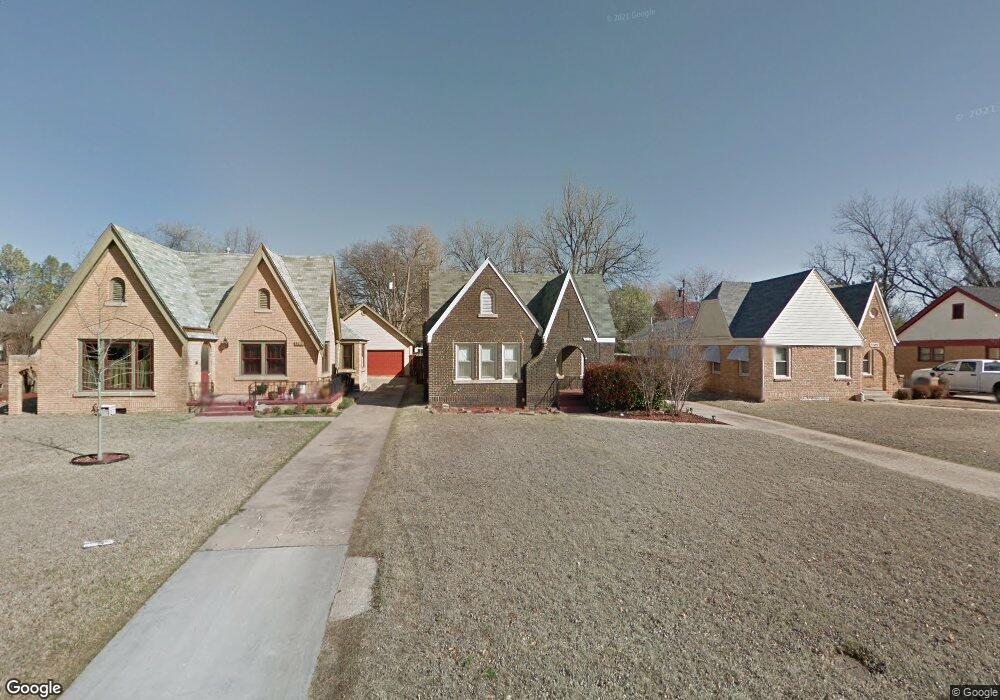
3313 NW 18th St Oklahoma City, OK 73107
Linwood Place NeighborhoodEstimated Value: $228,000 - $257,000
3
Beds
1
Bath
1,309
Sq Ft
$183/Sq Ft
Est. Value
About This Home
This home is located at 3313 NW 18th St, Oklahoma City, OK 73107 and is currently estimated at $239,484, approximately $182 per square foot. 3313 NW 18th St is a home located in Oklahoma County with nearby schools including Kaiser Elementary School, Taft Middle School, and Northwest Classen High School.
Ownership History
Date
Name
Owned For
Owner Type
Purchase Details
Closed on
Nov 26, 2013
Sold by
Pinkston Emily J and Pinkston Michael
Bought by
Stuart Daniel
Current Estimated Value
Home Financials for this Owner
Home Financials are based on the most recent Mortgage that was taken out on this home.
Original Mortgage
$79,500
Outstanding Balance
$59,724
Interest Rate
4.34%
Mortgage Type
New Conventional
Estimated Equity
$179,760
Purchase Details
Closed on
Jul 9, 2013
Sold by
Pinkston Emily J and Pinkston Michael
Bought by
Pinkston Emily J and Pinkston Michael
Purchase Details
Closed on
Jun 26, 2009
Sold by
Lombard David A and Lombard Sandi
Bought by
Malsom Emily J
Home Financials for this Owner
Home Financials are based on the most recent Mortgage that was taken out on this home.
Original Mortgage
$107,516
Interest Rate
4.97%
Mortgage Type
FHA
Purchase Details
Closed on
May 31, 1997
Sold by
Remington Doris
Bought by
Lombard David A
Create a Home Valuation Report for This Property
The Home Valuation Report is an in-depth analysis detailing your home's value as well as a comparison with similar homes in the area
Home Values in the Area
Average Home Value in this Area
Purchase History
| Date | Buyer | Sale Price | Title Company |
|---|---|---|---|
| Stuart Daniel | $139,500 | Trustmark Title | |
| Pinkston Emily J | -- | First American Title | |
| Malsom Emily J | $109,500 | Stewart Abstract & Title Of | |
| Lombard David A | $45,000 | -- |
Source: Public Records
Mortgage History
| Date | Status | Borrower | Loan Amount |
|---|---|---|---|
| Open | Stuart Daniel | $79,500 | |
| Previous Owner | Malsom Emily J | $107,516 |
Source: Public Records
Tax History Compared to Growth
Tax History
| Year | Tax Paid | Tax Assessment Tax Assessment Total Assessment is a certain percentage of the fair market value that is determined by local assessors to be the total taxable value of land and additions on the property. | Land | Improvement |
|---|---|---|---|---|
| 2024 | $2,543 | $21,737 | $3,051 | $18,686 |
| 2023 | $2,543 | $20,701 | $2,975 | $17,726 |
| 2022 | $2,319 | $19,715 | $3,176 | $16,539 |
| 2021 | $2,210 | $18,777 | $3,484 | $15,293 |
| 2020 | $2,130 | $17,883 | $3,435 | $14,448 |
| 2019 | $2,027 | $17,032 | $3,460 | $13,572 |
| 2018 | $1,727 | $16,221 | $0 | $0 |
| 2017 | $1,672 | $15,748 | $3,513 | $12,235 |
| 2016 | $1,621 | $15,289 | $2,895 | $12,394 |
| 2015 | $1,673 | $15,608 | $2,895 | $12,713 |
| 2014 | $1,649 | $15,489 | $2,895 | $12,594 |
Source: Public Records
Map
Nearby Homes
- 3216 NW 19th St
- 1819 N Woodward Ave
- 3326 NW 16th St
- 3405 NW 15th St
- 3424 NW 16th St
- 3416 NW 20th St
- 3429 NW 19th St
- 3132 NW 16th St
- 3232 NW 21st St
- 1421 N Independence Ave
- 3209 NW 14th St
- 3205 NW 14th St
- 3437 NW 20th St
- 3216 NW 14th St
- 1521 N Drexel Blvd
- 3104 NW 21st St
- 3517 NW 16th St
- 3217 NW 22nd St
- 3517 NW 20th St
- 3105 NW 22nd St
- 3309 NW 18th St
- 3317 NW 18th St
- 3305 NW 18th St
- 3321 NW 18th St
- 3325 NW 18th St
- 3301 NW 18th St
- 3316 NW 19th St
- 3300 NW 19th St
- 3329 NW 18th St
- 3312 NW 18th St
- 3316 NW 18th St
- 3308 NW 18th St
- 3328 NW 19th St
- 3320 NW 18th St
- 3304 NW 18th St
- 3333 NW 18th St
- 3324 NW 18th St
- 3300 NW 18th St
- 3245 NW 18th St
- 3328 NW 18th St