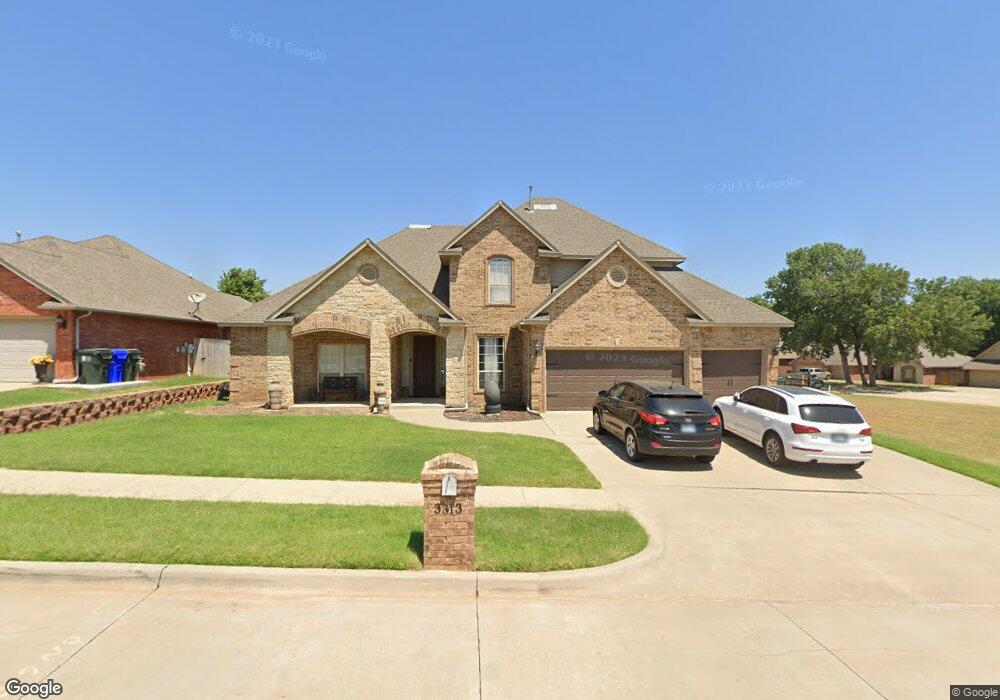
3313 Valley Meadow Norman, OK 73071
Southeast Norman NeighborhoodEstimated Value: $352,504 - $388,000
4
Beds
3
Baths
2,418
Sq Ft
$152/Sq Ft
Est. Value
About This Home
This home is located at 3313 Valley Meadow, Norman, OK 73071 and is currently estimated at $368,126, approximately $152 per square foot. 3313 Valley Meadow is a home located in Cleveland County with nearby schools including Ronald Reagan Elementary School, Irving Middle School, and Norman High School.
Ownership History
Date
Name
Owned For
Owner Type
Purchase Details
Closed on
Feb 2, 2010
Sold by
Parks Melissa A and Parks Frankie
Bought by
Parks Melissa A and Parks Frankie
Current Estimated Value
Purchase Details
Closed on
Jan 31, 2007
Sold by
J Mertens Const Inc
Bought by
Parks Melissa A
Home Financials for this Owner
Home Financials are based on the most recent Mortgage that was taken out on this home.
Original Mortgage
$218,440
Outstanding Balance
$130,618
Interest Rate
6.13%
Mortgage Type
New Conventional
Estimated Equity
$237,508
Purchase Details
Closed on
Jan 30, 2007
Sold by
Msdc Development Llc
Bought by
J Merters Const Inc
Home Financials for this Owner
Home Financials are based on the most recent Mortgage that was taken out on this home.
Original Mortgage
$218,440
Outstanding Balance
$130,618
Interest Rate
6.13%
Mortgage Type
New Conventional
Estimated Equity
$237,508
Purchase Details
Closed on
Oct 10, 2005
Sold by
Msdc Properties Llc
Bought by
J Mertens Const Inf
Create a Home Valuation Report for This Property
The Home Valuation Report is an in-depth analysis detailing your home's value as well as a comparison with similar homes in the area
Home Values in the Area
Average Home Value in this Area
Purchase History
| Date | Buyer | Sale Price | Title Company |
|---|---|---|---|
| Parks Melissa A | -- | None Available | |
| Parks Melissa A | $273,500 | None Available | |
| J Merters Const Inc | -- | None Available | |
| J Mertens Const Inf | $38,500 | None Available |
Source: Public Records
Mortgage History
| Date | Status | Borrower | Loan Amount |
|---|---|---|---|
| Open | Parks Melissa A | $218,440 |
Source: Public Records
Tax History Compared to Growth
Tax History
| Year | Tax Paid | Tax Assessment Tax Assessment Total Assessment is a certain percentage of the fair market value that is determined by local assessors to be the total taxable value of land and additions on the property. | Land | Improvement |
|---|---|---|---|---|
| 2024 | $3,902 | $32,577 | $5,633 | $26,944 |
| 2023 | $3,727 | $31,026 | $5,605 | $25,421 |
| 2022 | $3,404 | $29,549 | $5,364 | $24,185 |
| 2021 | $3,417 | $28,142 | $5,282 | $22,860 |
| 2020 | $3,184 | $26,802 | $3,960 | $22,842 |
| 2019 | $3,238 | $26,802 | $3,960 | $22,842 |
| 2018 | $3,141 | $26,802 | $3,960 | $22,842 |
| 2017 | $3,176 | $26,802 | $0 | $0 |
| 2016 | $3,228 | $26,802 | $3,960 | $22,842 |
| 2015 | $3,198 | $27,377 | $3,960 | $23,417 |
| 2014 | $3,229 | $27,377 | $3,960 | $23,417 |
Source: Public Records
Map
Nearby Homes
- 3300 Valley Brook
- 3325 Valley Hollow
- 3409 Valley Hollow
- 3209 Valley Hollow
- 3595 E State Highway 9
- 2125 Valley Hollow
- 2109 Valley Hollow
- 3624 Abingdon Dr
- 2001 Oakville Place
- 3018 Hollow Crest Ln
- 3014 Hollow Crest Ln
- 2308 Norwood Dr
- 3010 Hollow Crest Ln
- 0 E 36th St Unit 1126583
- 1918 Hollow Crest Ct
- 1914 Hollow Crest Ct
- 1910 Hollow Crest Ct
- Brea Plan at Bellatona
- Providence Plan at Bellatona
- Taylor Plan at Bellatona
- 3309 Valley Meadow
- 3317 Valley Meadow
- 3312 Valley Brook
- 3316 Valley Meadow
- 3316 Valley Brook
- 3312 Valley Meadow
- 3305 Valley Meadow
- 3308 Valley Brook
- 3308 Valley Meadow
- 3320 Valley Meadow
- 3301 Valley Meadow
- 3304 Valley Meadow
- 3321 Wood Valley Rd
- 3329 Wood Valley Rd
- 3325 Wood Valley Rd
- 3317 Wood Valley Rd
- 3313 Wood Valley Rd
- 3300 Valley Meadow
- 3225 Valley Meadow
- 3333 Wood Valley Rd