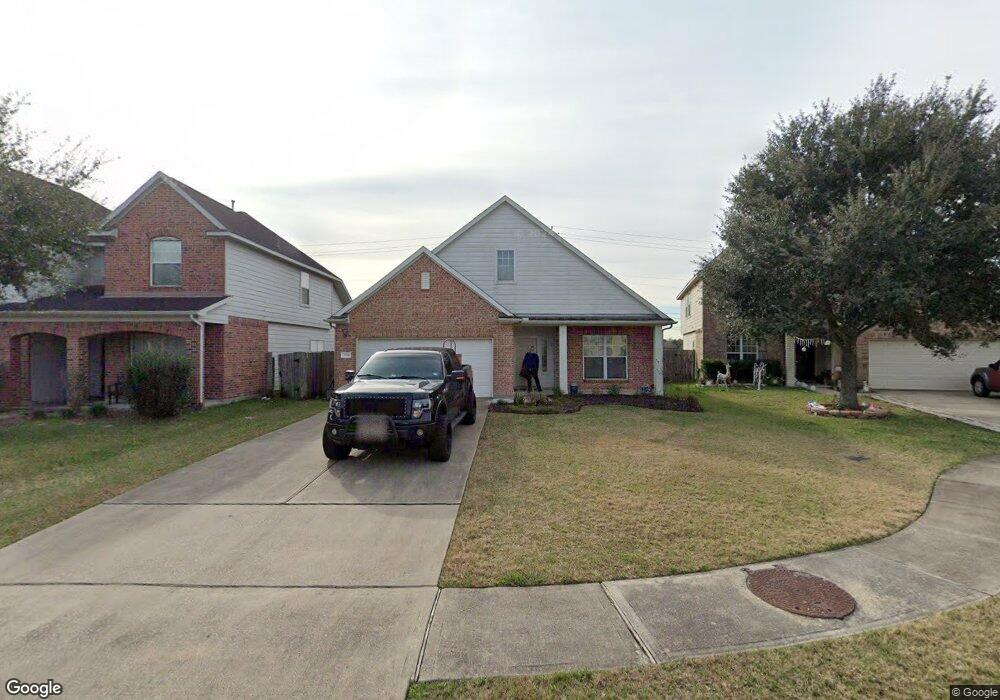
3314 Cypress Landing Ct Rosenberg, TX 77471
Estimated Value: $247,000 - $276,000
3
Beds
2
Baths
1,831
Sq Ft
$143/Sq Ft
Est. Value
About This Home
This home is located at 3314 Cypress Landing Ct, Rosenberg, TX 77471 and is currently estimated at $261,741, approximately $142 per square foot. 3314 Cypress Landing Ct is a home located in Fort Bend County with nearby schools including Navarro Middle School, George Junior High School, and B.F. Terry High School.
Ownership History
Date
Name
Owned For
Owner Type
Purchase Details
Closed on
Mar 2, 2017
Sold by
Maravilla Joseph and Maravilla Amy
Bought by
Barta Amanda J
Current Estimated Value
Purchase Details
Closed on
Aug 3, 2007
Sold by
Terramark Homes Ltd
Bought by
Maravilla Joseph and Maravilla Amy
Home Financials for this Owner
Home Financials are based on the most recent Mortgage that was taken out on this home.
Original Mortgage
$139,935
Interest Rate
6.69%
Mortgage Type
VA
Purchase Details
Closed on
Mar 14, 2006
Sold by
Stephens/Tingley Lp
Bought by
Terramark Homes Ltd and Turner Adreac Residential Lc
Home Financials for this Owner
Home Financials are based on the most recent Mortgage that was taken out on this home.
Original Mortgage
$330,400
Interest Rate
6.19%
Mortgage Type
Purchase Money Mortgage
Create a Home Valuation Report for This Property
The Home Valuation Report is an in-depth analysis detailing your home's value as well as a comparison with similar homes in the area
Home Values in the Area
Average Home Value in this Area
Purchase History
| Date | Buyer | Sale Price | Title Company |
|---|---|---|---|
| Barta Amanda J | -- | None Available | |
| Maravilla Joseph | -- | Stewart Title Fort Bend | |
| Barta Amanda J | -- | -- | |
| Terramark Homes Ltd | -- | Chicago Title Sugar Land | |
| Barta Amanda J | -- | -- |
Source: Public Records
Mortgage History
| Date | Status | Borrower | Loan Amount |
|---|---|---|---|
| Previous Owner | Barta Amanda J | $139,935 | |
| Previous Owner | Barta Amanda J | $330,400 |
Source: Public Records
Tax History Compared to Growth
Tax History
| Year | Tax Paid | Tax Assessment Tax Assessment Total Assessment is a certain percentage of the fair market value that is determined by local assessors to be the total taxable value of land and additions on the property. | Land | Improvement |
|---|---|---|---|---|
| 2025 | $2,819 | $240,561 | $33,963 | $206,598 |
| 2024 | $2,819 | $227,879 | $19,034 | $208,845 |
| 2023 | $2,526 | $207,163 | $0 | $244,306 |
| 2022 | $3,057 | $188,330 | $0 | $194,770 |
| 2021 | $3,552 | $171,210 | $26,130 | $145,080 |
| 2020 | $3,466 | $163,330 | $26,130 | $137,200 |
| 2019 | $3,462 | $151,590 | $26,130 | $125,460 |
| 2018 | $3,745 | $161,350 | $26,130 | $135,220 |
| 2017 | $3,565 | $152,750 | $26,130 | $126,620 |
| 2016 | $3,441 | $147,440 | $26,130 | $121,310 |
| 2015 | $2,643 | $134,040 | $26,130 | $107,910 |
| 2014 | $2,887 | $137,080 | $26,130 | $110,950 |
Source: Public Records
Map
Nearby Homes
- 2211 Hackberry Bank Ln
- 3219 Creole Bay Ln
- 3604 Rychlik Dr
- 3608 Avenue R
- 2126 Ripple Creek Dr
- 1926 Klauke Ct
- 2002 Austin St
- 2635 Sequoia Ln
- 2500 Parkway Ave
- 3433 Avenue P
- 1803 Jones St
- 1921 Ripple Creek Dr
- 1711 Klauke St
- 1733 Brumbelow St
- 2717 Parrott Ave
- 2705 Parrott Ave
- 1633 Jones St
- 2217 Bernie Ave
- 2417 4th St
- 1317 Tobola St
- 3318 Cypress Landing Ct
- 3310 Cypress Landing Ct
- 3322 Cypress Landing Ct
- 3306 Cypress Landing Ct
- 3402 Cypress Landing Ct
- 3302 Cypress Landing Ct
- 3315 Cypress Landing Ct
- 3319 Cypress Landing Ct
- 3406 Cypress Landing Ct
- 3307 Cypress Landing Ct
- 3403 Cypress Landing Ct
- 3303 Cypress Landing Ct
- 3410 Cypress Landing Ct
- 3407 Cypress Landing Ct
- 3407 Cypress Landing Ct
- 3414 Cypress Landing Ct
- 3411 Cypress Landing Ct
- 3418 Cypress Landing Ct
- 3415 Cypress Landing Ct
- 3422 Cypress Landing Ct