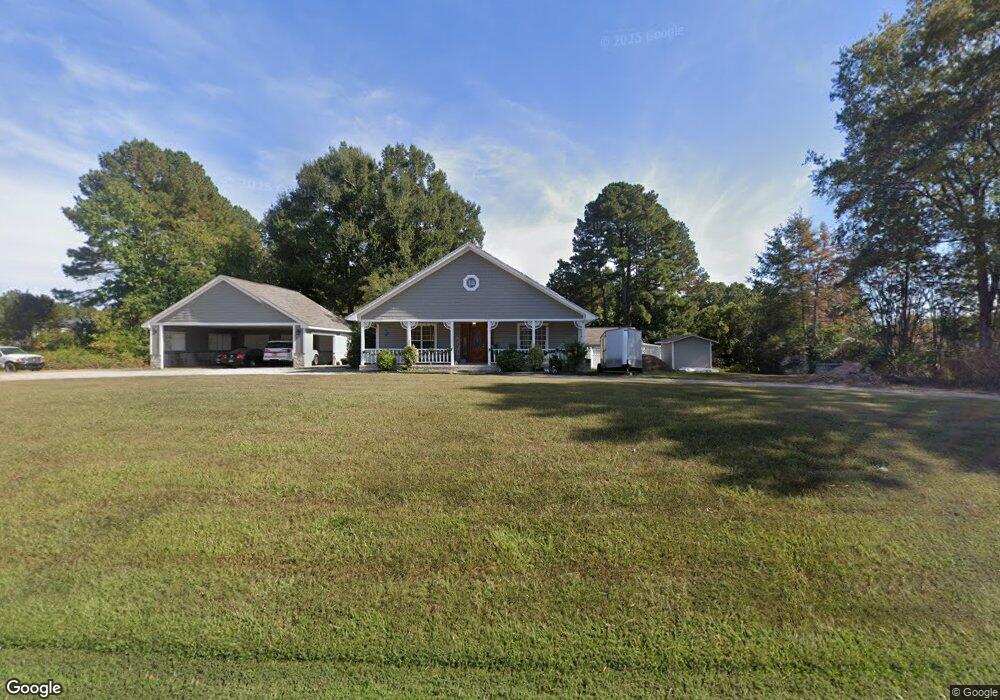
3314 E Geer St Durham, NC 27704
Northeast Durham NeighborhoodEstimated Value: $377,000 - $505,436
3
Beds
1
Bath
2,520
Sq Ft
$180/Sq Ft
Est. Value
About This Home
This home is located at 3314 E Geer St, Durham, NC 27704 and is currently estimated at $453,609, approximately $180 per square foot. 3314 E Geer St is a home located in Durham County with nearby schools including Glenn Elementary, John W Neal Middle School, and Southern School of Energy & Sustainability.
Ownership History
Date
Name
Owned For
Owner Type
Purchase Details
Closed on
Apr 1, 2015
Sold by
Roberts Luther Daniel and Roberts Shelia C
Bought by
Evans Cynthia Dawn Roberts and Evans John William
Current Estimated Value
Home Financials for this Owner
Home Financials are based on the most recent Mortgage that was taken out on this home.
Original Mortgage
$202,000
Outstanding Balance
$158,333
Interest Rate
4.25%
Mortgage Type
Adjustable Rate Mortgage/ARM
Estimated Equity
$295,276
Purchase Details
Closed on
Mar 2, 2004
Sold by
Summerlin David C and Summerlin Mary C
Bought by
Glenn Bennie C and Glenn David Morris
Home Financials for this Owner
Home Financials are based on the most recent Mortgage that was taken out on this home.
Original Mortgage
$300,000
Interest Rate
5.63%
Mortgage Type
Seller Take Back
Create a Home Valuation Report for This Property
The Home Valuation Report is an in-depth analysis detailing your home's value as well as a comparison with similar homes in the area
Home Values in the Area
Average Home Value in this Area
Purchase History
| Date | Buyer | Sale Price | Title Company |
|---|---|---|---|
| Evans Cynthia Dawn Roberts | $200,000 | None Available | |
| Glenn Bennie C | $300,000 | -- |
Source: Public Records
Mortgage History
| Date | Status | Borrower | Loan Amount |
|---|---|---|---|
| Open | Evans Cynthia Dawn Roberts | $202,000 | |
| Previous Owner | Glenn Bennie C | $300,000 |
Source: Public Records
Tax History
| Year | Tax Paid | Tax Assessment Tax Assessment Total Assessment is a certain percentage of the fair market value that is determined by local assessors to be the total taxable value of land and additions on the property. | Land | Improvement |
|---|---|---|---|---|
| 2025 | $3,309 | $455,201 | $164,200 | $291,001 |
| 2024 | $3,191 | $308,982 | $53,781 | $255,201 |
| 2023 | $3,000 | $308,982 | $53,781 | $255,201 |
| 2022 | $2,871 | $308,982 | $53,781 | $255,201 |
| 2021 | $2,610 | $308,982 | $53,781 | $255,201 |
| 2020 | $2,579 | $308,982 | $53,781 | $255,201 |
| 2019 | $2,579 | $308,982 | $53,781 | $255,201 |
| 2018 | $1,592 | $174,491 | $37,357 | $137,134 |
| 2017 | $1,574 | $174,491 | $37,357 | $137,134 |
| 2016 | $1,526 | $174,491 | $37,357 | $137,134 |
| 2015 | $1,050 | $97,770 | $38,503 | $59,267 |
| 2014 | $1,050 | $97,770 | $38,503 | $59,267 |
Source: Public Records
Map
Nearby Homes
- 3519 E Geer St
- 2830 Tulip Poplar Cir
- 2810 Catamount Ct
- 2616 Bullock Rd
- 3329 Broughton Dr
- 1111 Sawmill Grove Dr
- 1117 Sawmill Grove Dr
- 1123 Sawmill Grove Dr
- 1138 Sawmill Grove Dr
- 1133 Sawmill Grove Dr
- 1142 Sawmill Grove Dr
- 1144 Sawmill Grove Dr
- 1207 Sawmill Grove Dr
- 1215 Carpenter Falls Ave
- 3032 Hammer Creek Rd
- 2805 Redwood #4b Rd
- 1135 Sawmill Grove Dr
- 1136 Sawmill Grove Dr
- 1127 Sawmill Grove Dr
- 1206 Sawmill Grove Dr
- 2742 Cooksbury Dr
- 3320 E Geer St
- 2740 Cooksbury Dr
- 3308 E Geer St
- 2736 Cooksbury Dr
- 3409 Red Mill Rd
- 2734 Cooksbury Dr
- 3240 E Geer St
- 2728 Cooksbury Dr
- 3239 E Geer St
- 3232 E Geer St
- 3401 Gorman Church Rd
- 2735 Cooksbury Dr
- 2726 Cooksbury Dr
- 3237 E Geer St
- 2724 Cooksbury Dr
- 3233 E Geer St
- 2721 Cooksbury Dr
- 3231 E Geer St
- 3320 Gorman Church Rd
Your Personal Tour Guide
Ask me questions while you tour the home.