NOT LISTED FOR SALE

3314 Halsted St Steger, IL 60475

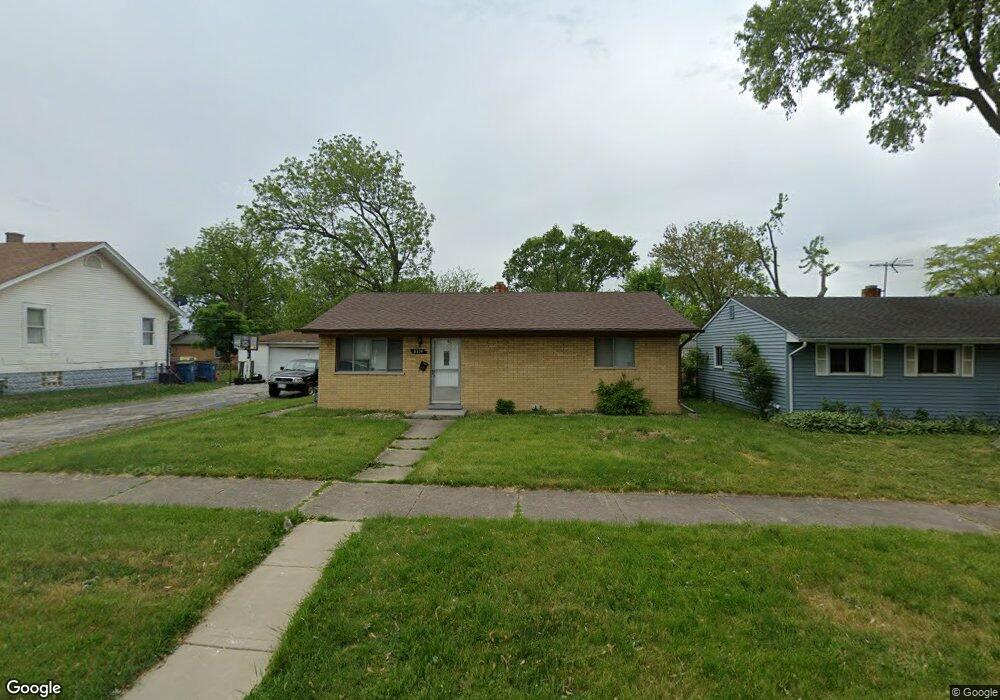
Estimated Value: $126,000 - $173,000

2 Beds
1 Bath
936 Sq Ft
$164/Sq Ft Est. Value

Last Sold December 10, 2019

Last sale price $47,500 $51 Per Sq Ft

Est. 222% increase in value since last sale

Current estimated payment $946/month

About This Home

Beautifully rehabbed home that's a great starter, no stairs, and nothing to do but move in! Nicely finished touches, large rooms and large back yard great for family gatherings. New furnace.

Ownership History

Date Name Owned For Owner Type

Purchase Details

Listed on
Apr 5, 2019
Closed on
Dec 10, 2019
Sold by
Islam Bader
Bought by
Rutz Oscar
Seller's Agent
Alice Green
Real People Realty
Buyer's Agent
Ronald Gregory
Listing Leaders Northwest, Inc
List Price
$55,000
Sold Price
$47,500
Premium/Discount to List
-$7,500
-13.64%
Current Estimated Value
$153,183

Home Financials for this Owner

Home Financials are based on the most recent Mortgage that was taken out on this home.
Estimated Appreciation
$105,683
Avg. Annual Appreciation
20.46%

Purchase Details

Closed on
Jun 28, 2018
Sold by
Federoff Donald W
Bought by
Smart Rentals Llc
Source: Public Records

Range of Values:

--
Value Increase
--
Percent Increase
--
Adjusted for Inflation
Collateral Analytics

Collateral Analytics Collateral Analytics AVMs (Automated Valuation Model) employ a number of statistical approaches combined with neighborhood-specific comparable selection guarantees the most up-to-date and precise valuations.

Not Available

Collateral Analytics does not have data for the current month. Please view the chart for historical values.

ICE

ICE Mortgage Technology ICE Mortgage Technology’s AVM (Automated Valuation Model) is a state-of-the-art online residential property valuation tool that provides a quick and accurate estimate of the value of almost any home in the U.S.

Not Available

ICE Mortgage Technology does not have data for the current month. Please view the chart for historical values.

First American

First American First American Data & Analytics’ next-generation AVM combines unrivaled data assets with a blended ensemble of valuation models to produce highly accurate, reliable valuations you can trust.

Not Available

First American does not have data for the current month. Please view the chart for historical values.

Quantarium

Quantarium Quantarium’s valuation service, repeatedly proven the industry’s most accurate and comprehensive, is supercharged with a self-learning and auto-tuning AI engine that continually becomes smarter and more accurate as it processes daily inputs from the industry’s leading RE data lake.

Not Available

Quantarium does not have data for the current month. Please view the chart for historical values.

Average Value
Not Available
List Price
Sold Price
Create a Home Valuation Report for This Property
The Home Valuation Report is an in-depth analysis detailing your home's value as well as a comparison with similar homes in the area

Home Values in the Area

Source: Public Records

Average Home Value in this Area


Source: Public Records

Purchase History

Date Buyer Sale Price Title Company
Rutz Oscar $47,500 Fidelity National Title
Smart Rentals Llc $26,000 Fidelity National Title
Source: Public Records

Property History

Date Event Price List to Sale Price per Sq Ft Prior Sale
12/10/2019 12/10/19 Sold $47,500 -13.6% $51 / Sq Ft View Prior Sale
11/19/2019 11/19/19 Pending -- -- --
10/11/2019 10/11/19 For Sale $55,000 0.0% $59 / Sq Ft
05/26/2019 05/26/19 Pending -- -- --
04/23/2019 04/23/19 For Sale $55,000 0.0% $59 / Sq Ft
04/16/2019 04/16/19 Pending -- -- --
04/05/2019 04/05/19 For Sale $55,000 -- $59 / Sq Ft

Tax History

Year Tax Paid Tax Assessment Tax Assessment Total Assessment is a certain percentage of the fair market value that is determined by local assessors to be the total taxable value of land and additions on the property. Land Improvement
2025 $1,675 $5,059 $1,094 $3,965
2024 $1,675 $5,059 $1,094 $3,965
2023 $1,265 $5,059 $1,094 $3,965
2022 $1,265 $3,123 $938 $2,185
2021 $1,181 $3,122 $937 $2,185
2020 $1,157 $3,122 $937 $2,185
2019 $1,371 $3,796 $859 $2,937
2018 $1,325 $3,796 $859 $2,937
2017 $1,342 $3,796 $859 $2,937
2016 $1,418 $3,963 $781 $3,182
2015 $1,412 $3,963 $781 $3,182
2014 $241 $3,963 $781 $3,182
2013 $226 $3,979 $781 $3,198
Source: Public Records

Agents Affiliated with this Home

  • Section Image
  • Section Image
See All Agents

Map

Your Personal Tour Guide

Ask me questions while you tour the home.