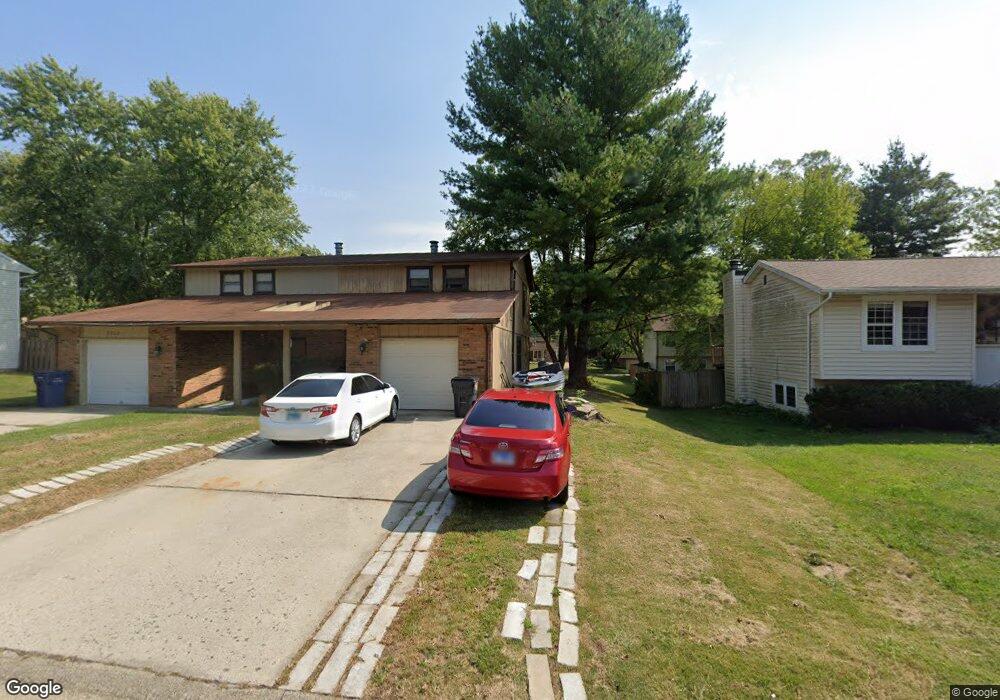
3314 Saratoga Dr Belleville, IL 62221
Estimated Value: $130,000 - $151,000
3
Beds
2
Baths
1,560
Sq Ft
$89/Sq Ft
Est. Value
About This Home
This home is located at 3314 Saratoga Dr, Belleville, IL 62221 and is currently estimated at $139,532, approximately $89 per square foot. 3314 Saratoga Dr is a home located in St. Clair County with nearby schools including Belle Valley Elementary School-North, Zion Lutheran School Belleville, and St Teresa Catholic School.
Ownership History
Date
Name
Owned For
Owner Type
Purchase Details
Closed on
Mar 6, 2016
Sold by
First County Bank
Bought by
Chamma Walid
Current Estimated Value
Purchase Details
Closed on
May 20, 2015
Sold by
Stillwater Corporation
Bought by
First County Bank
Purchase Details
Closed on
Jul 22, 2010
Sold by
Homesales Inc
Bought by
Stillwater Corp and Saratoga Trust 3314
Purchase Details
Closed on
Jun 9, 2010
Sold by
Secretary Of Veterans Affairs
Bought by
Homesales Inc
Purchase Details
Closed on
Sep 9, 2009
Sold by
Sketch Matthew A
Bought by
The Secretary Of Veteran Affairs
Purchase Details
Closed on
May 9, 2003
Sold by
Doussard Robert J
Bought by
Sketch Matthew A
Home Financials for this Owner
Home Financials are based on the most recent Mortgage that was taken out on this home.
Original Mortgage
$77,520
Interest Rate
6.02%
Mortgage Type
VA
Create a Home Valuation Report for This Property
The Home Valuation Report is an in-depth analysis detailing your home's value as well as a comparison with similar homes in the area
Home Values in the Area
Average Home Value in this Area
Purchase History
| Date | Buyer | Sale Price | Title Company |
|---|---|---|---|
| Chamma Walid | $36,500 | Abstracts & Title Inc | |
| First County Bank | -- | Fatic | |
| Stillwater Corp | $51,000 | First American Title Insuran | |
| Homesales Inc | -- | None Available | |
| The Secretary Of Veteran Affairs | -- | None Available | |
| Sketch Matthew A | $76,000 | Town & Country Title Co |
Source: Public Records
Mortgage History
| Date | Status | Borrower | Loan Amount |
|---|---|---|---|
| Previous Owner | Sketch Matthew A | $77,520 |
Source: Public Records
Tax History Compared to Growth
Tax History
| Year | Tax Paid | Tax Assessment Tax Assessment Total Assessment is a certain percentage of the fair market value that is determined by local assessors to be the total taxable value of land and additions on the property. | Land | Improvement |
|---|---|---|---|---|
| 2024 | $3,395 | $33,327 | $4,348 | $28,979 |
| 2023 | $2,395 | $22,659 | $4,263 | $18,396 |
| 2022 | $2,236 | $20,399 | $3,838 | $16,561 |
| 2021 | $2,156 | $18,858 | $3,548 | $15,310 |
| 2020 | $2,118 | $31,924 | $3,355 | $28,569 |
| 2019 | $2,791 | $23,167 | $3,360 | $19,807 |
| 2018 | $2,810 | $23,654 | $3,287 | $20,367 |
| 2017 | $2,776 | $23,488 | $3,264 | $20,224 |
| 2016 | $2,732 | $24,643 | $3,195 | $21,448 |
| 2014 | $1,683 | $31,433 | $4,514 | $26,919 |
| 2013 | -- | $31,883 | $4,579 | $27,304 |
Source: Public Records
Map
Nearby Homes
- 3313 Denvershire Dr
- 0 Denvershire Dr
- 650 Fort Henry Rd
- 747 Farragut Ct
- 3335 Dovershire Dr
- 3301 Fox Valley Ln
- 2009 Camrose Green St
- 2001 Camrose Green St
- 2013 Camrose Green St
- 2005 Camrose Green St
- 2017 Camrose Green St
- 2021 Camrose Green St
- 2000 Camrose Green St
- 2004 Camrose Green St
- 2012 Camrose Green St
- 2016 Camrose Green St
- 2049 Camrose Green St
- 2020 Camrose Green St
- 2053 Camrose Green St
- 2057 Camrose Green St
- 3312 Saratoga Dr
- 3316 Saratoga Dr
- 3308 Saratoga Dr
- 3317 Denvershire Dr
- 3320 Saratoga Dr
- 3309 Denvershire Dr
- 3313 Saratoga Dr
- 3317 Saratoga Dr
- 3321 Denvershire Dr
- 3309 Saratoga Dr
- 3306 Saratoga Dr
- 3321 Saratoga Dr
- 3304 Saratoga Dr
- 3305 Denvershire Dr
- 3324 Saratoga Dr
- 3325 Denvershire Dr
- 3305 Saratoga Dr
- 3312 Denvershire Dr
- 3312 Devonshire Dr
- 3312 Dovershire Dr