
Seller's Agent in 2015
JAMI WINCHESTER
The Real Estate Group, Inc.
(217) 306-1000
1,421 Total Sales
Estimated Value: $79,000 - $95,000
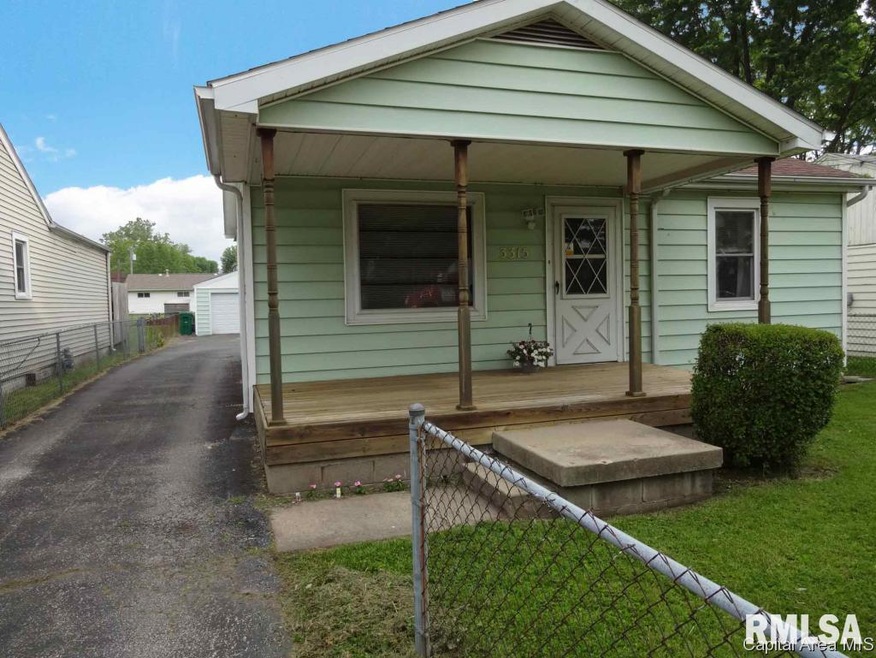
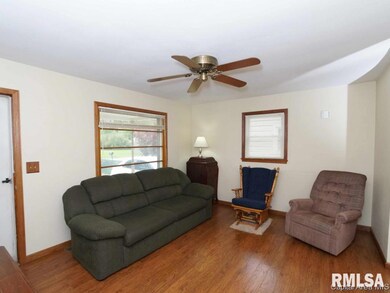
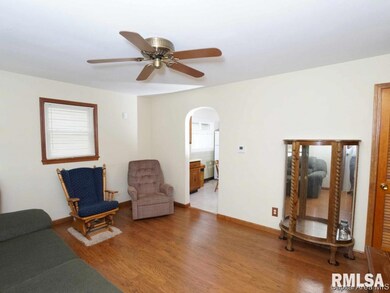
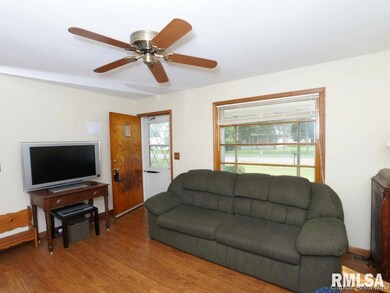
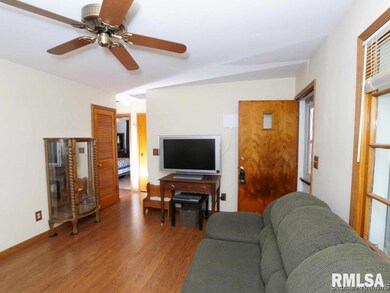
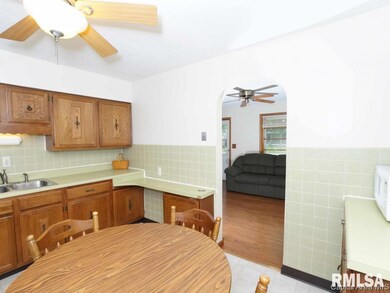
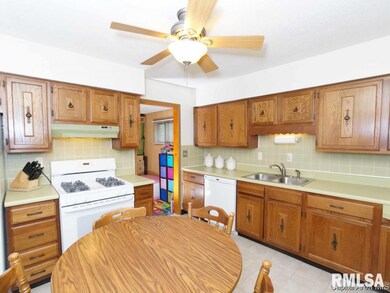
COMPARE THIS ADORABLE HOME TO WHAT YOU'RE PAYING IN RENT AND SAVE $$! MANY RECENT UPDATES THAT INCLUDE WATER HEATER & FURNACE IN 2014, NEWER FLOORING, SOME NEW WINDOWS, UPDATED ELECTRICAL PANEL. NEWER GARAGE DOOR, BACK DOOR, & STORM DOOR. ROOF NEW IN 2006. OVERSIZED 2.5 CAR GARAGE (24.5 X 24.5). FENCED FRONT & BACK YARD. PLEASE BE SURE TO ASK ABOUT ONE OF THE FIRST TIME HOME BUYER GRANTS THAT YOU COULD POTENTIALLY USE WHEN PURCHASING THIS HOME.
Last Agent to Sell the Property
The Real Estate Group, Inc. License #475109074 Listed on: 05/29/2015
| Date | Buyer | Sale Price | Title Company |
|---|---|---|---|
| -- | $55,500 | -- | |
| -- | -- | -- | |
| -- | $59,900 | -- | |
| -- | $42,900 | -- |
| Date | Event | Price | List to Sale | Price per Sq Ft |
|---|---|---|---|---|
| 10/16/2015 10/16/15 | Sold | $55,500 | -3.5% | $69 / Sq Ft |
| 09/03/2015 09/03/15 | Pending | -- | -- | -- |
| 05/29/2015 05/29/15 | For Sale | $57,500 | -- | $71 / Sq Ft |
| Year | Tax Paid | Tax Assessment Tax Assessment Total Assessment is a certain percentage of the fair market value that is determined by local assessors to be the total taxable value of land and additions on the property. | Land | Improvement |
|---|---|---|---|---|
| 2024 | $1,492 | $23,781 | $2,817 | $20,964 |
| 2023 | $1,383 | $21,545 | $2,552 | $18,993 |
| 2022 | $1,308 | $20,509 | $2,429 | $18,080 |
| 2021 | $983 | $18,807 | $2,227 | $16,580 |
| 2020 | $948 | $18,698 | $2,214 | $16,484 |
| 2019 | $924 | $18,628 | $2,206 | $16,422 |
| 2018 | $924 | $18,981 | $2,248 | $16,733 |
| 2017 | $1,114 | $19,314 | $2,180 | $17,134 |
| 2016 | $820 | $15,807 | $2,058 | $13,749 |
| 2015 | $816 | $15,735 | $2,049 | $13,686 |
| 2014 | $848 | $16,245 | $2,115 | $14,130 |
| 2013 | $895 | $17,158 | $2,234 | $14,924 |
Seller's Agent in 2015
JAMI WINCHESTER
The Real Estate Group, Inc.
(217) 306-1000
1,421 Total Sales
Buyer's Agent in 2015
Wendi Fryman
The Real Estate Group, Inc.
(217) 638-4861
Source: RMLS Alliance
MLS Number: RMACA152927
APN: 14-25.0-402-030
Disclaimer: Certain information contained herein is derived from information provided by parties other than Homes.com. All information provided is deemed reliable, but is not guaranteed to be accurate and should be independently verified.
![]() Based on information submitted to the MLS GRID. All data is obtained from various sources and may not have been verified by broker or MLS GRID. Supplied Open House Information is subject to change without notice. All information should be independently reviewed and verified for accuracy. Properties may or may not be listed by the office/agent presenting the information. Some IDX listings have been excluded from this website.IDX information is provided exclusively for personal, non-commercial use, and may not be used for any purpose other than to identify prospective properties consumers may be interested in purchasing. Information is deemed reliable but not guaranteed.
Based on information submitted to the MLS GRID. All data is obtained from various sources and may not have been verified by broker or MLS GRID. Supplied Open House Information is subject to change without notice. All information should be independently reviewed and verified for accuracy. Properties may or may not be listed by the office/agent presenting the information. Some IDX listings have been excluded from this website.IDX information is provided exclusively for personal, non-commercial use, and may not be used for any purpose other than to identify prospective properties consumers may be interested in purchasing. Information is deemed reliable but not guaranteed.
Based on information submitted to the MLS GRID
Ask me questions while you tour the home.