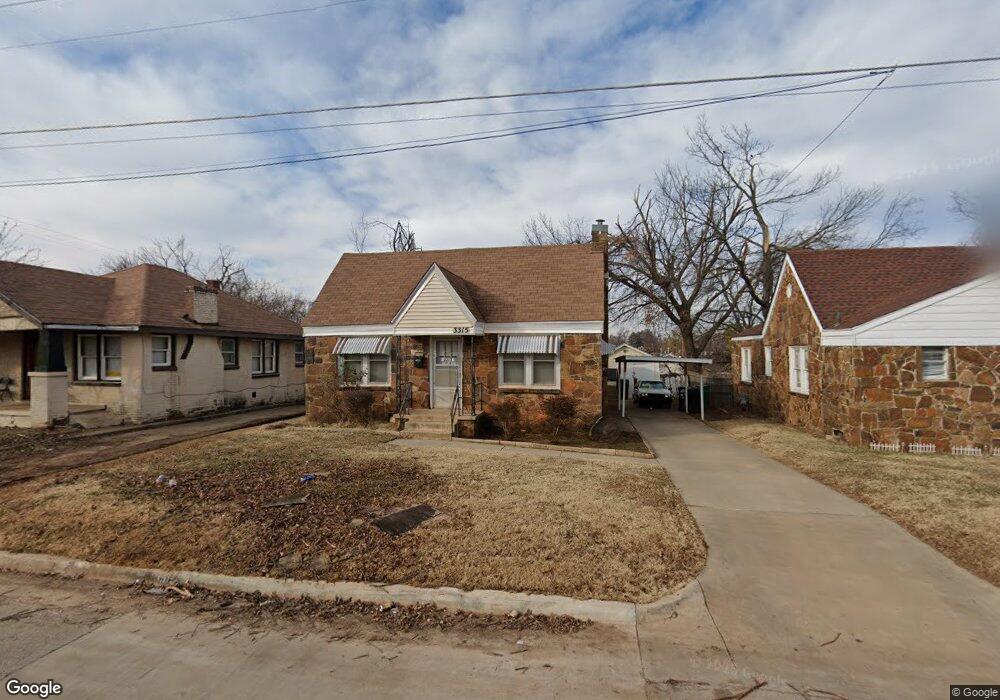
3315 N Youngs Blvd Oklahoma City, OK 73112
Sequoyah NeighborhoodEstimated Value: $119,000 - $179,000
2
Beds
1
Bath
1,102
Sq Ft
$140/Sq Ft
Est. Value
About This Home
This home is located at 3315 N Youngs Blvd, Oklahoma City, OK 73112 and is currently estimated at $154,375, approximately $140 per square foot. 3315 N Youngs Blvd is a home located in Oklahoma County with nearby schools including Cleveland Elementary School, Taft Middle School, and Northwest Classen High School.
Ownership History
Date
Name
Owned For
Owner Type
Purchase Details
Closed on
Dec 7, 2021
Sold by
Ckc Holdings Llc
Bought by
Ckc Holdings Llc
Current Estimated Value
Purchase Details
Closed on
Sep 15, 2021
Sold by
The Worx Business Group Inc
Bought by
Ckc Holdings Llc
Home Financials for this Owner
Home Financials are based on the most recent Mortgage that was taken out on this home.
Original Mortgage
$144,500
Outstanding Balance
$131,484
Interest Rate
2.8%
Mortgage Type
Commercial
Estimated Equity
$22,891
Purchase Details
Closed on
Jul 23, 2021
Sold by
Jefferson Robert H and Jefferson Deborah A
Bought by
The Worx Business Group Inc
Home Financials for this Owner
Home Financials are based on the most recent Mortgage that was taken out on this home.
Original Mortgage
$144,500
Outstanding Balance
$131,484
Interest Rate
2.8%
Mortgage Type
Commercial
Estimated Equity
$22,891
Purchase Details
Closed on
Nov 8, 2002
Sold by
Huffman Estelle and Estelle Huffman Trust
Bought by
Jefferson Robert H and Jefferson Deborah A
Create a Home Valuation Report for This Property
The Home Valuation Report is an in-depth analysis detailing your home's value as well as a comparison with similar homes in the area
Home Values in the Area
Average Home Value in this Area
Purchase History
| Date | Buyer | Sale Price | Title Company |
|---|---|---|---|
| Ckc Holdings Llc | -- | None Available | |
| Ckc Holdings Llc | $100,000 | Chicago Title Oklahoma Co | |
| The Worx Business Group Inc | $65,000 | Chicago Title Oklahoma Co | |
| Jefferson Robert H | $37,500 | Capitol Abstract & Title Co |
Source: Public Records
Mortgage History
| Date | Status | Borrower | Loan Amount |
|---|---|---|---|
| Open | Ckc Holdings Llc | $144,500 | |
| Previous Owner | The Worx Business Group Inc | $101,703 |
Source: Public Records
Tax History Compared to Growth
Tax History
| Year | Tax Paid | Tax Assessment Tax Assessment Total Assessment is a certain percentage of the fair market value that is determined by local assessors to be the total taxable value of land and additions on the property. | Land | Improvement |
|---|---|---|---|---|
| 2024 | $1,404 | $12,005 | $1,681 | $10,324 |
| 2023 | $1,404 | $11,434 | $1,679 | $9,755 |
| 2022 | $1,281 | $10,890 | $1,809 | $9,081 |
| 2021 | $914 | $7,766 | $1,597 | $6,169 |
| 2020 | $881 | $7,397 | $1,521 | $5,876 |
| 2019 | $838 | $7,045 | $1,459 | $5,586 |
| 2018 | $761 | $6,710 | $0 | $0 |
| 2017 | $729 | $6,434 | $1,640 | $4,794 |
| 2016 | $701 | $6,184 | $1,685 | $4,499 |
| 2015 | $675 | $5,891 | $1,694 | $4,197 |
| 2014 | $641 | $5,634 | $1,694 | $3,940 |
Source: Public Records
Map
Nearby Homes
- 2243 NW 32nd St
- 2410 NW 32nd St
- 2140 NW 34th St
- 2341 Cashion Place
- 2237 NW 30th St
- 2109 NW 31st St
- 2332 NW 36th St
- 2441 NW 35th St
- 501 NW 30th St
- 2033 NW 31st Terrace
- 2141 NW 29th St
- 2022 NW 33rd St
- 3800 Key Place
- 2525 NW 35th St
- 2537 NW 31st St
- 2329 NW 28th St
- 2010 NW 34th St
- 2124 NW 29th St
- 2109 NW 36th St
- 3522 N Westmont St
- 3311 N Youngs Blvd
- 3319 N Youngs Blvd
- 2312 NW 33rd St
- 3307 N Youngs Blvd
- 2316 NW 33rd St
- 3401 N Youngs Blvd
- 2315 NW 32nd St
- 2246 NW 33rd St
- 3301 N Youngs Blvd
- 2245 NW 33rd St
- 2319 NW 32nd St
- 2309 NW 33rd St
- 2320 NW 33rd St
- 2313 NW 33rd St
- 2240 NW 33rd St
- 3409 N Youngs Blvd
- 2317 NW 33rd St
- 2241 NW 33rd St
- 2323 NW 32nd St
- 2247 NW 32nd St