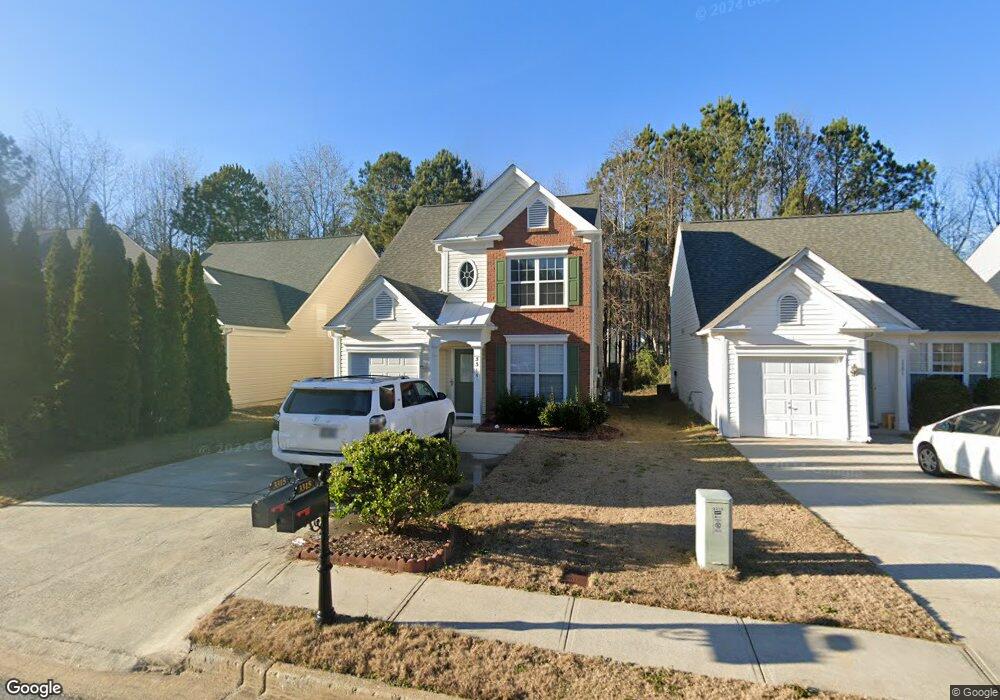
3315 Oxwell Dr Unit 1B Duluth, GA 30096
Estimated Value: $369,000 - $379,000
3
Beds
3
Baths
1,453
Sq Ft
$257/Sq Ft
Est. Value
About This Home
This home is located at 3315 Oxwell Dr Unit 1B, Duluth, GA 30096 and is currently estimated at $373,625, approximately $257 per square foot. 3315 Oxwell Dr Unit 1B is a home located in Gwinnett County with nearby schools including B.B. Harris Elementary School, Duluth Middle School, and Duluth High School.
Ownership History
Date
Name
Owned For
Owner Type
Purchase Details
Closed on
Oct 30, 2006
Sold by
Johnson Glenn E
Bought by
Zheng Qing
Current Estimated Value
Home Financials for this Owner
Home Financials are based on the most recent Mortgage that was taken out on this home.
Original Mortgage
$137,600
Interest Rate
6.01%
Mortgage Type
New Conventional
Purchase Details
Closed on
Jun 20, 2003
Sold by
Hampton Francine D
Bought by
Johnson Glenn E
Home Financials for this Owner
Home Financials are based on the most recent Mortgage that was taken out on this home.
Original Mortgage
$155,400
Interest Rate
5.3%
Mortgage Type
New Conventional
Purchase Details
Closed on
Jul 30, 1999
Sold by
Pulte Home Corp
Bought by
Hampton Francine D
Home Financials for this Owner
Home Financials are based on the most recent Mortgage that was taken out on this home.
Original Mortgage
$129,090
Interest Rate
7.66%
Mortgage Type
FHA
Create a Home Valuation Report for This Property
The Home Valuation Report is an in-depth analysis detailing your home's value as well as a comparison with similar homes in the area
Home Values in the Area
Average Home Value in this Area
Purchase History
| Date | Buyer | Sale Price | Title Company |
|---|---|---|---|
| Zheng Qing | $172,000 | -- | |
| Johnson Glenn E | $155,400 | -- | |
| Hampton Francine D | $130,700 | -- |
Source: Public Records
Mortgage History
| Date | Status | Borrower | Loan Amount |
|---|---|---|---|
| Closed | Zheng Qing | $137,600 | |
| Previous Owner | Johnson Glenn E | $155,400 | |
| Previous Owner | Hampton Francine D | $129,090 |
Source: Public Records
Tax History Compared to Growth
Tax History
| Year | Tax Paid | Tax Assessment Tax Assessment Total Assessment is a certain percentage of the fair market value that is determined by local assessors to be the total taxable value of land and additions on the property. | Land | Improvement |
|---|---|---|---|---|
| 2025 | $5,063 | $134,800 | $30,000 | $104,800 |
| 2024 | -- | $134,800 | $30,000 | $104,800 |
| 2023 | $5,111 | $139,120 | $30,000 | $109,120 |
| 2022 | $4,469 | $117,560 | $24,000 | $93,560 |
| 2021 | $2,967 | $90,880 | $18,000 | $72,880 |
| 2020 | $2,987 | $90,880 | $18,000 | $72,880 |
| 2019 | $2,805 | $86,200 | $18,000 | $68,200 |
| 2018 | $2,581 | $75,880 | $14,800 | $61,080 |
| 2016 | $2,574 | $65,080 | $14,000 | $51,080 |
| 2015 | $2,274 | $55,960 | $14,000 | $41,960 |
| 2014 | -- | $53,480 | $12,800 | $40,680 |
Source: Public Records
Map
Nearby Homes
- 3412 Davenport Park Ln
- 3215 Oxwell Dr Unit 1B
- 3190 Oxwell Dr
- 3289 Davenport Park Ln
- 2995 Oxwell Dr Unit 1
- 3053 Hartright Bend Ct
- 2644 Davenport Rd
- 3576 Randy Place
- 2702 Davenport Rd
- 3315 Oak Hampton Way Unit 1
- 3593 Gainesway Ct
- 3592 Gainesway Trace
- 3614 Gainesway Trace
- 2829 Cardinal Trace
- 2888 Cardinal Trace
- 3518 Tracey Dr
- 2820 Bluebird Cir NW
- 2239 Dandridge Dr
- 2961 Creek Dr
- 2590 Village Place Dr
- 3305 Oxwell Dr
- 3325 Oxwell Dr Unit 1B
- 3335 Oxwell Dr
- 3295 Oxwell Dr Unit 1B
- 3345 Oxwell Dr
- 3285 Oxwell Dr NW
- 3372 Davenport Park Ln
- 3372 Davenport Park Ln Unit 79
- 3285 Oxwell Dr
- 3382 Davenport Park Ln
- 3310 Oxwell Dr Unit IB
- 3392 Davenport Park Ln Unit 1
- 3275 Oxwell Dr
- 3300 Oxwell Dr
- 3362 Davenport Park Ln Unit 1
- 3320 Oxwell Dr
- 3402 Davenport Park Ln
- 3365 Oxwell Dr
- 3340 Oxwell Dr Unit IB
- 3355 Oxwell Dr Unit I