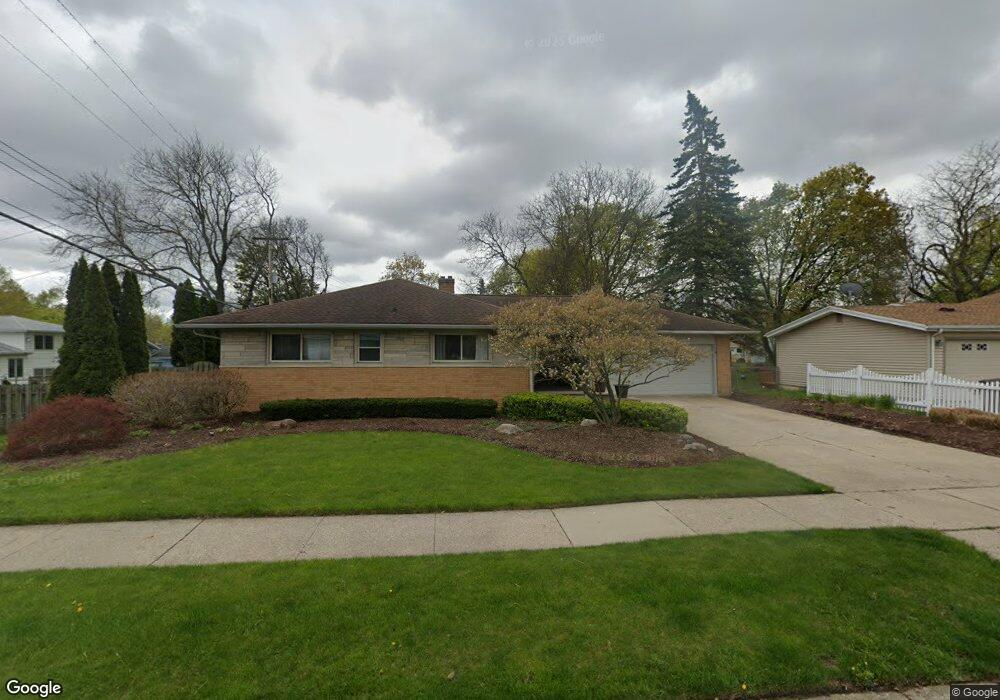
3315 Snowglen Ln Lansing, MI 48917
Edgemont Park NeighborhoodEstimated Value: $245,000 - $263,000
3
Beds
2
Baths
1,440
Sq Ft
$175/Sq Ft
Est. Value
About This Home
This home is located at 3315 Snowglen Ln, Lansing, MI 48917 and is currently estimated at $252,209, approximately $175 per square foot. 3315 Snowglen Ln is a home located in Ingham County with nearby schools including Waverly Senior High School, Mid-Michigan Leadership Academy, and Windemere Park Charter Academy.
Ownership History
Date
Name
Owned For
Owner Type
Purchase Details
Closed on
Apr 28, 2005
Sold by
Stewart Alan C and Stewart Sandra K
Bought by
Thompson Jerre and Thompson Rebecca S
Current Estimated Value
Home Financials for this Owner
Home Financials are based on the most recent Mortgage that was taken out on this home.
Original Mortgage
$139,600
Interest Rate
5.91%
Mortgage Type
Fannie Mae Freddie Mac
Purchase Details
Closed on
Sep 16, 2004
Sold by
Christy Jean M
Bought by
Stewart Alan C and Stewart Sandra K
Home Financials for this Owner
Home Financials are based on the most recent Mortgage that was taken out on this home.
Original Mortgage
$85,850
Interest Rate
5.93%
Mortgage Type
Purchase Money Mortgage
Purchase Details
Closed on
May 9, 2002
Sold by
Christy Jean M
Bought by
Christy Jean M and The Jean M Christy Revocable Trust #1
Create a Home Valuation Report for This Property
The Home Valuation Report is an in-depth analysis detailing your home's value as well as a comparison with similar homes in the area
Home Values in the Area
Average Home Value in this Area
Purchase History
| Date | Buyer | Sale Price | Title Company |
|---|---|---|---|
| Thompson Jerre | $174,500 | Fatic | |
| Stewart Alan C | $115,000 | Fatic | |
| Christy Jean M | -- | -- |
Source: Public Records
Mortgage History
| Date | Status | Borrower | Loan Amount |
|---|---|---|---|
| Previous Owner | Thompson Jerre | $139,600 | |
| Previous Owner | Stewart Alan C | $85,850 |
Source: Public Records
Tax History Compared to Growth
Tax History
| Year | Tax Paid | Tax Assessment Tax Assessment Total Assessment is a certain percentage of the fair market value that is determined by local assessors to be the total taxable value of land and additions on the property. | Land | Improvement |
|---|---|---|---|---|
| 2025 | $4,604 | $122,300 | $38,100 | $84,200 |
| 2024 | $4,485 | $112,100 | $30,800 | $81,300 |
| 2023 | $4,485 | $98,900 | $30,800 | $68,100 |
| 2022 | $4,317 | $87,800 | $28,200 | $59,600 |
| 2021 | $4,322 | $83,800 | $25,000 | $58,800 |
| 2020 | $3,981 | $81,200 | $25,000 | $56,200 |
| 2019 | $3,949 | $76,200 | $18,100 | $58,100 |
| 2018 | $3,870 | $70,000 | $11,900 | $58,100 |
| 2017 | $3,750 | $70,000 | $11,900 | $58,100 |
| 2016 | -- | $67,300 | $14,500 | $52,800 |
| 2015 | -- | $65,700 | $29,038 | $36,662 |
| 2014 | -- | $60,800 | $26,618 | $34,182 |
Source: Public Records
Map
Nearby Homes
- 3322 Pickwick Place
- 3316 W Willow St
- 3333 W Willow St
- 3502 Springbrook Ln
- 1610 Ravenswood Dr
- 1222 Ravenswood Dr
- 1805 Boynton Dr
- 3001 Risley Dr
- 3014 Timber Dr
- 2817 W Willow St
- 1920 Briarwood Dr
- 3435 Hagan St
- 2123 Cogswell Dr
- 2206 Kuerbitz Dr
- 2300 Byrnes Rd
- 3116 Colchester Rd
- 3500 Colchester Rd
- 2519 Byrnes Rd
- 2524 Newport Dr
- 2400 Leon Ave
- 3323 Snowglen Ln
- 1437 Briarwood Dr
- 1431 Briarwood Dr
- 1425 Briarwood Dr
- 3329 Snowglen Ln
- 3246 Pickwick Place
- 3306 Pickwick Place
- 1419 Briarwood Dr
- 3240 Pickwick Place
- 3304 Snowglen Ln
- 3310 Pickwick Place
- 3335 Snowglen Ln
- 3318 Snowglen Ln
- 1413 Briarwood Dr
- 3324 Snowglen Ln
- 1511 Briarwood Dr
- 3220 Snowglen Ln
- 3341 Snowglen Ln
- 3330 Snowglen Ln
- 1442 Briarwood Dr