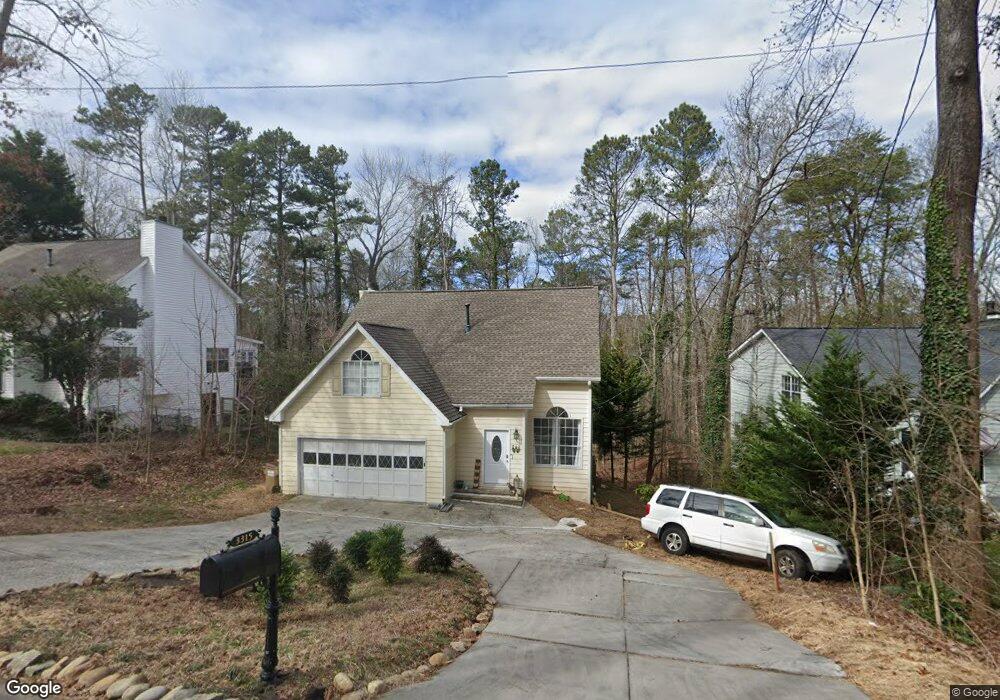
3315 Southshore Cir Unit 8 Cumming, GA 30041
Estimated Value: $394,000 - $445,000
3
Beds
3
Baths
2,085
Sq Ft
$202/Sq Ft
Est. Value
About This Home
This home is located at 3315 Southshore Cir Unit 8, Cumming, GA 30041 and is currently estimated at $420,616, approximately $201 per square foot. 3315 Southshore Cir Unit 8 is a home located in Forsyth County with nearby schools including Mashburn Elementary School, Lakeside Middle School, and Forsyth Central High School.
Ownership History
Date
Name
Owned For
Owner Type
Purchase Details
Closed on
Jul 15, 2021
Sold by
Lawson Kerri Ann
Bought by
Rmi Sfr Propco A Lp
Current Estimated Value
Purchase Details
Closed on
Jun 29, 2017
Sold by
Dutton Martin J
Bought by
Lawson Adam and Lawson Kerri
Home Financials for this Owner
Home Financials are based on the most recent Mortgage that was taken out on this home.
Original Mortgage
$219,622
Interest Rate
3.94%
Mortgage Type
VA
Purchase Details
Closed on
Jun 15, 1999
Sold by
Vilt Carter G E
Bought by
Duton Martin J
Home Financials for this Owner
Home Financials are based on the most recent Mortgage that was taken out on this home.
Original Mortgage
$90,350
Interest Rate
7.13%
Mortgage Type
New Conventional
Purchase Details
Closed on
Oct 22, 1993
Sold by
Our Generations Inc
Bought by
Volt Carter G E
Home Financials for this Owner
Home Financials are based on the most recent Mortgage that was taken out on this home.
Original Mortgage
$75,000
Interest Rate
4%
Create a Home Valuation Report for This Property
The Home Valuation Report is an in-depth analysis detailing your home's value as well as a comparison with similar homes in the area
Home Values in the Area
Average Home Value in this Area
Purchase History
| Date | Buyer | Sale Price | Title Company |
|---|---|---|---|
| Rmi Sfr Propco A Lp | $300,000 | -- | |
| Lawson Adam | $215,000 | -- | |
| Duton Martin J | $139,000 | -- | |
| Volt Carter G E | $108,500 | -- |
Source: Public Records
Mortgage History
| Date | Status | Borrower | Loan Amount |
|---|---|---|---|
| Previous Owner | Lawson Adam | $219,622 | |
| Previous Owner | Duton Martin J | $90,350 | |
| Previous Owner | Volt Carter G E | $75,000 |
Source: Public Records
Tax History Compared to Growth
Tax History
| Year | Tax Paid | Tax Assessment Tax Assessment Total Assessment is a certain percentage of the fair market value that is determined by local assessors to be the total taxable value of land and additions on the property. | Land | Improvement |
|---|---|---|---|---|
| 2025 | $3,626 | $147,852 | $48,000 | $99,852 |
| 2024 | $3,626 | $147,852 | $48,000 | $99,852 |
| 2023 | $3,628 | $147,852 | $48,000 | $99,852 |
| 2022 | $3,277 | $102,412 | $28,800 | $73,612 |
| 2021 | $2,607 | $102,412 | $28,800 | $73,612 |
| 2020 | $2,501 | $97,232 | $28,800 | $68,432 |
| 2019 | $2,505 | $97,252 | $26,000 | $71,252 |
| 2018 | $2,276 | $86,000 | $26,680 | $59,320 |
| 2017 | $2,324 | $83,720 | $26,000 | $57,720 |
| 2016 | $2,082 | $75,000 | $20,000 | $55,000 |
| 2015 | $1,959 | $70,440 | $18,000 | $52,440 |
| 2014 | $1,686 | $63,700 | $18,000 | $45,700 |
Source: Public Records
Map
Nearby Homes
- 2935 Hamilton Rd Unit IV
- 2995 Hamilton Rd
- 3235 Southshore Ct
- 3705 Tradewinds Dr
- 3706 Tradewinds Dr
- 3200 Rim Cove Dr Unit 172
- 3200 Rim Cove Dr Unit 116
- LOT 51 Brook Valley Dr
- LOT 50 Brook Valley Dr
- LOT 48 Brook Valley Dr
- LOT 52 Brook Valley Dr
- LOT 47 Brook Valley Dr
- LOT 54 Brook Valley Dr
- 2420 Wanda Woods Rd
- 3430 Lake Shore Dr
- 2765 Port Bow Ln
- 2835 Evan Manor Ln
- 2575 Maple Park Place
- 2205 Forest Dr
- 2735 Hanson Ct
- 3315 Southshore Cir
- 3325 Southshore Cir Unit 3325
- 3325 Southshore Cir
- 3305 Southshore Cir Unit 7
- 3305 Southshore Cir
- 3335 Southshore Cir
- 3315 Southshore Ln
- 3235 Southshore Cir
- 3340 Southshore Cir
- 0 Southshore Cir
- 3310 Southshore Ln
- 3330 Southshore Ln
- Lot 19 S Shore Ln
- S Southshore Ln Unit 18
- 3355 Southshore Cir
- 3345 Southshore Ln
- 3345 Southshore Ln Unit 19
- 0 South Shore Unit 19 7301290
- 3365 Southshore Cir
- 3230 Southshore Cir