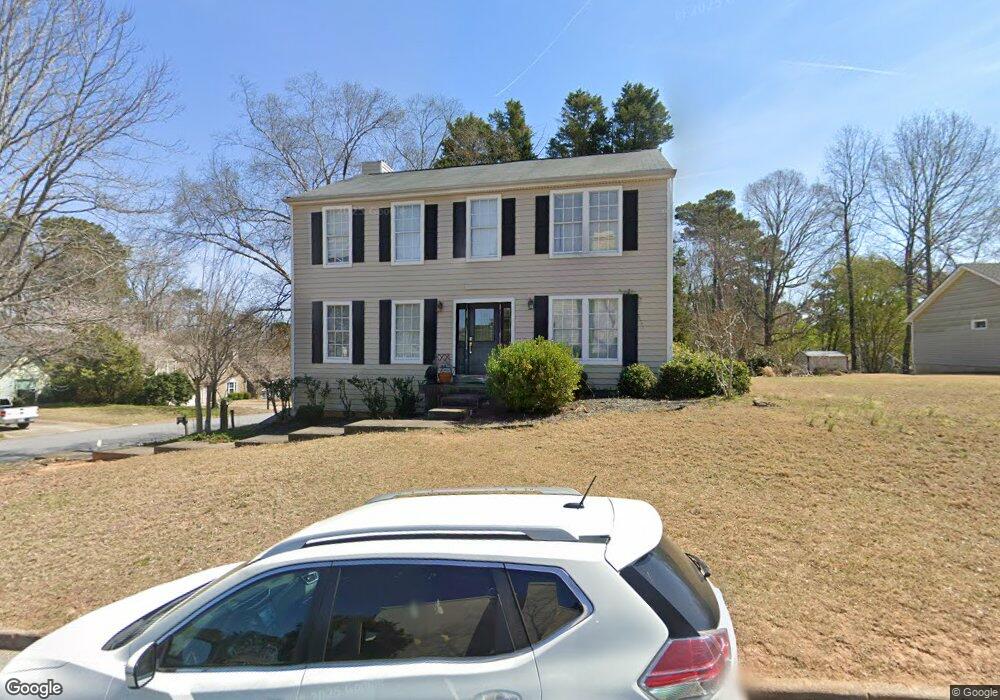
3315 Summer View Dr Unit III Alpharetta, GA 30022
Newtown NeighborhoodEstimated Value: $508,000 - $540,000
4
Beds
3
Baths
2,202
Sq Ft
$240/Sq Ft
Est. Value
About This Home
This home is located at 3315 Summer View Dr Unit III, Alpharetta, GA 30022 and is currently estimated at $528,093, approximately $239 per square foot. 3315 Summer View Dr Unit III is a home located in Fulton County with nearby schools including Northwood Elementary School, Haynes Bridge Middle School, and Centennial High School.
Ownership History
Date
Name
Owned For
Owner Type
Purchase Details
Closed on
Jul 15, 1999
Sold by
Humphries Peyton K and Humphries Deborah S
Bought by
Haynes William E and Haynes Paula E
Current Estimated Value
Home Financials for this Owner
Home Financials are based on the most recent Mortgage that was taken out on this home.
Original Mortgage
$135,600
Outstanding Balance
$38,253
Interest Rate
7.65%
Mortgage Type
New Conventional
Estimated Equity
$489,840
Purchase Details
Closed on
Sep 15, 1997
Sold by
Milano Paul F and Milano Barbara
Bought by
Humphries Peyton K and Humphries Deborah
Home Financials for this Owner
Home Financials are based on the most recent Mortgage that was taken out on this home.
Original Mortgage
$112,000
Interest Rate
7%
Mortgage Type
New Conventional
Create a Home Valuation Report for This Property
The Home Valuation Report is an in-depth analysis detailing your home's value as well as a comparison with similar homes in the area
Home Values in the Area
Average Home Value in this Area
Purchase History
| Date | Buyer | Sale Price | Title Company |
|---|---|---|---|
| Haynes William E | $169,500 | -- | |
| Humphries Peyton K | $140,000 | -- |
Source: Public Records
Mortgage History
| Date | Status | Borrower | Loan Amount |
|---|---|---|---|
| Open | Haynes William E | $135,600 | |
| Previous Owner | Humphries Peyton K | $112,000 |
Source: Public Records
Tax History Compared to Growth
Tax History
| Year | Tax Paid | Tax Assessment Tax Assessment Total Assessment is a certain percentage of the fair market value that is determined by local assessors to be the total taxable value of land and additions on the property. | Land | Improvement |
|---|---|---|---|---|
| 2025 | $3,043 | $177,840 | $39,920 | $137,920 |
| 2023 | $5,253 | $186,120 | $38,960 | $147,160 |
| 2022 | $2,914 | $156,560 | $31,600 | $124,960 |
| 2021 | $2,881 | $139,360 | $20,280 | $119,080 |
| 2020 | $2,894 | $130,760 | $22,360 | $108,400 |
| 2019 | $353 | $128,440 | $21,960 | $106,480 |
| 2018 | $3,386 | $125,400 | $21,440 | $103,960 |
| 2017 | $2,837 | $96,120 | $9,720 | $86,400 |
| 2016 | $2,732 | $96,120 | $9,720 | $86,400 |
| 2015 | $2,665 | $92,040 | $9,720 | $82,320 |
| 2014 | $1,701 | $61,280 | $11,760 | $49,520 |
Source: Public Records
Map
Nearby Homes
- 3335 Waters Mill Dr
- 3273 Long Indian Creek Ct
- 3195 Waters Mill Dr
- 3430 Waters Mill Dr
- 10505 Ash Rill Dr
- 725 High Hampton Run
- 3396 Carverton Ln
- 305 Birch Rill Dr
- 300 Olmstead Way
- 201 Downing Dr Unit 76
- 10421 Park Walk Point
- 235 Wood Shoals Ct
- 10255 Old Woodland Entry
- 415 Wood Trace Ct
- 385 Birch Rill Dr
- 130 Forrest View Terrace
- 825 Highland Bend Cove
- 225 Wentworth Terrace
- 335 Stanyan Place Unit 2
- 3325 Summer View Dr Unit 3
- 10585 Summer Ridge Dr
- 3295 Summer View Dr
- 3335 Summer View Dr Unit 111
- 10575 Summer Ridge Dr
- 3310 Summer View Dr Unit 3
- 3320 Summer View Dr
- 3320 Summer View Dr Unit 58
- 110 Summer Crest Ct
- 3330 Summer View Dr
- 3300 Summer View Dr Unit III
- 10580 Summer Ridge Dr
- 3285 Summer View Dr Unit 3
- 120 Summer Crest Ct
- 0 Summer Crest Ct Unit 3219087
- 0 Summer Crest Ct Unit 7570755
- 0 Summer Crest Ct Unit 7549444
- 3345 Summer View Dr Unit 3
- 3340 Summer View Dr Unit 3
- 3290 Summer View Dr