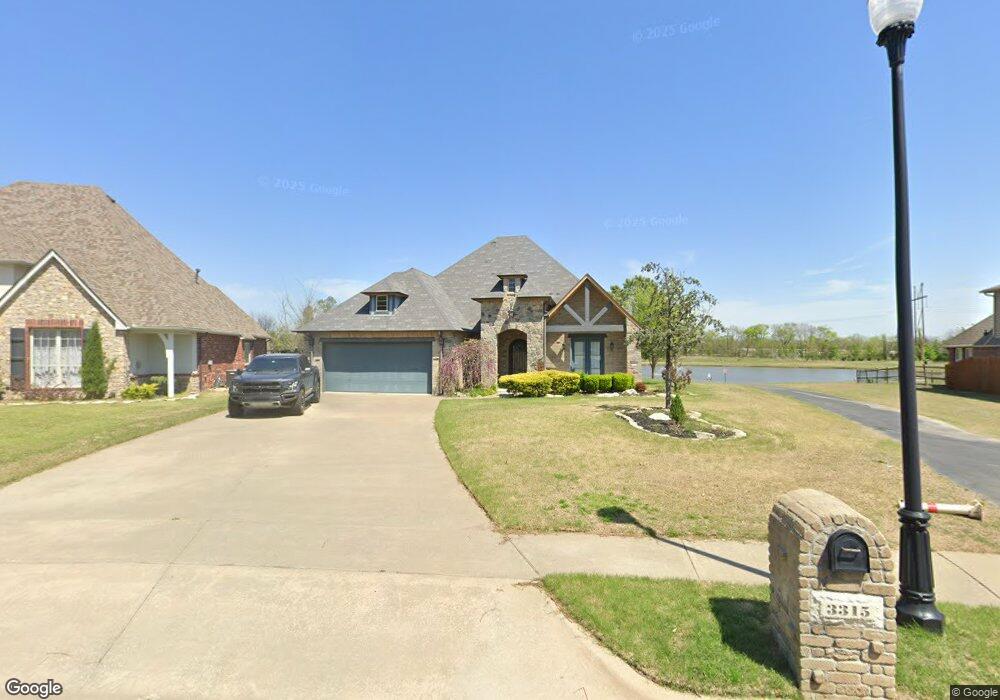
3315 W 109th St S Sapulpa, OK 74066
Estimated Value: $495,213 - $522,000
--
Bed
3
Baths
3,274
Sq Ft
$156/Sq Ft
Est. Value
About This Home
This home is located at 3315 W 109th St S, Sapulpa, OK 74066 and is currently estimated at $510,553, approximately $155 per square foot. 3315 W 109th St S is a home located in Tulsa County with nearby schools including Jenks West Elementary School, Jenks West Intermediate Elementary School, and Jenks Middle School.
Ownership History
Date
Name
Owned For
Owner Type
Purchase Details
Closed on
Mar 15, 2018
Sold by
Holland Gary and Holland Yng Li
Bought by
Crowley Shannon
Current Estimated Value
Home Financials for this Owner
Home Financials are based on the most recent Mortgage that was taken out on this home.
Original Mortgage
$413,725
Outstanding Balance
$354,024
Interest Rate
4.32%
Mortgage Type
New Conventional
Estimated Equity
$156,529
Purchase Details
Closed on
May 14, 2013
Sold by
Ingram Jimmie Lee and Ingram Alice Videlle
Bought by
Holland Gary
Home Financials for this Owner
Home Financials are based on the most recent Mortgage that was taken out on this home.
Original Mortgage
$414,000
Interest Rate
3.56%
Mortgage Type
VA
Purchase Details
Closed on
Oct 17, 2006
Sold by
Sherwood Builders Llc
Bought by
Ingram Jimmie Lee and Ingram Alice Videlle
Create a Home Valuation Report for This Property
The Home Valuation Report is an in-depth analysis detailing your home's value as well as a comparison with similar homes in the area
Home Values in the Area
Average Home Value in this Area
Purchase History
| Date | Buyer | Sale Price | Title Company |
|---|---|---|---|
| Crowley Shannon | $435,500 | None Available | |
| Holland Gary | $414,000 | Multiple | |
| Ingram Jimmie Lee | $59,500 | None Available |
Source: Public Records
Mortgage History
| Date | Status | Borrower | Loan Amount |
|---|---|---|---|
| Open | Crowley Shannon | $413,725 | |
| Previous Owner | Holland Gary | $414,000 |
Source: Public Records
Tax History Compared to Growth
Tax History
| Year | Tax Paid | Tax Assessment Tax Assessment Total Assessment is a certain percentage of the fair market value that is determined by local assessors to be the total taxable value of land and additions on the property. | Land | Improvement |
|---|---|---|---|---|
| 2024 | $5,988 | $49,386 | $6,471 | $42,915 |
| 2023 | $5,988 | $47,034 | $6,864 | $40,170 |
| 2022 | $6,404 | $49,821 | $6,864 | $42,957 |
| 2021 | $6,238 | $47,905 | $6,600 | $41,305 |
| 2020 | $6,101 | $47,905 | $6,600 | $41,305 |
| 2019 | $6,142 | $47,905 | $6,600 | $41,305 |
| 2018 | $0 | $0 | $0 | $0 |
| 2017 | $0 | $45,540 | $6,600 | $38,940 |
| 2016 | $0 | $45,540 | $6,600 | $38,940 |
| 2015 | -- | $45,540 | $6,600 | $38,940 |
| 2014 | -- | $45,540 | $6,545 | $38,995 |
Source: Public Records
Map
Nearby Homes
- 3710 W 110th St S
- 3706 W 106th St S
- 11009 Augusta Dr
- 10739 Masters Cir
- 11275 S Douglas Ave
- 10910 S Olmsted St
- 2957 W 114th Place S
- 11608 S Union Ave
- 2629 W 115th St S
- 10417 S 33rd West Ave
- 10732 S 33rd West Ave
- 10317 S Nathan St
- 2012 W 109th St S
- 11602 S 30th West Ave
- 11710 S Willow Place
- 11206 S Redbud St
- 11728 S Willow Place
- 1623 W 114th St
- 12002 S Vine St
- 110 W 113th St S
- 3322 W 109th St S
- 3317 W 109th St S
- 3311 W 109th St S
- 3319 W 109th St S
- 3405 W 109th St S
- 10919 S Hamilton Ct
- 3313 W 110th St S
- 3315 W 110th St S
- 3407 W 109th St S
- 3317 W 110th St S
- 10921 S Hamilton Ct
- 3409 W 109th St S
- 3405 W 110th St S
- 10923 S Hamilton Ct
- 10707 S James Ct
- 3411 W 109th St S
- 11004 S Hamilton Ct
- 10705 S James Ct
- 11004 S Hamilton Ct
- 11003 S Hamilton Ct