Estimated Value: $251,981 - $287,000
3
Beds
2
Baths
1,118
Sq Ft
$244/Sq Ft
Est. Value
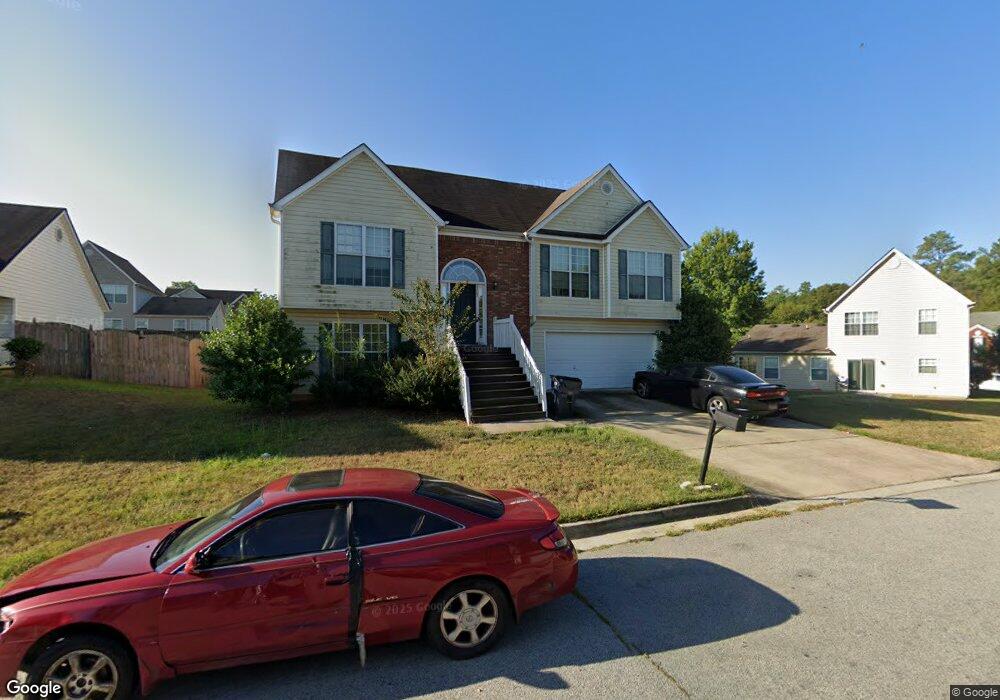
About This Home
This home is located at 3315 Waggoner Place, Rex, GA 30273 and is currently estimated at $272,245, approximately $243 per square foot. 3315 Waggoner Place is a home located in Clayton County with nearby schools including East Clayton Elementary School, Adamson Middle School, and Morrow High School.
Ownership History
Date
Name
Owned For
Owner Type
Purchase Details
Closed on
Aug 16, 2010
Sold by
Citigroup Series 2006-Fx1
Bought by
Johnson Dekarrio E
Current Estimated Value
Home Financials for this Owner
Home Financials are based on the most recent Mortgage that was taken out on this home.
Original Mortgage
$59,202
Interest Rate
4.5%
Mortgage Type
FHA
Purchase Details
Closed on
Apr 6, 2010
Sold by
Noel Lourdes
Bought by
Citigroup Series 2006-Fx1
Purchase Details
Closed on
Jul 31, 2006
Sold by
Gt Architecture Contractors Co
Bought by
Noel Lourdes
Home Financials for this Owner
Home Financials are based on the most recent Mortgage that was taken out on this home.
Original Mortgage
$121,200
Interest Rate
6.68%
Mortgage Type
New Conventional
Purchase Details
Closed on
Mar 1, 2006
Sold by
Southside Dev Inc
Bought by
Gt Architecture Contractors Co
Home Financials for this Owner
Home Financials are based on the most recent Mortgage that was taken out on this home.
Original Mortgage
$908,936
Interest Rate
6.19%
Create a Home Valuation Report for This Property
The Home Valuation Report is an in-depth analysis detailing your home's value as well as a comparison with similar homes in the area
Home Values in the Area
Average Home Value in this Area
Purchase History
| Date | Buyer | Sale Price | Title Company |
|---|---|---|---|
| Johnson Dekarrio E | $60,000 | -- | |
| Citigroup Series 2006-Fx1 | $65,000 | -- | |
| Noel Lourdes | $151,000 | -- | |
| Gt Architecture Contractors Co | $320,000 | -- |
Source: Public Records
Mortgage History
| Date | Status | Borrower | Loan Amount |
|---|---|---|---|
| Closed | Johnson Dekarrio E | $59,202 | |
| Previous Owner | Noel Lourdes | $121,200 | |
| Previous Owner | Gt Architecture Contractors Co | $908,936 |
Source: Public Records
Tax History
| Year | Tax Paid | Tax Assessment Tax Assessment Total Assessment is a certain percentage of the fair market value that is determined by local assessors to be the total taxable value of land and additions on the property. | Land | Improvement |
|---|---|---|---|---|
| 2025 | $3,512 | $100,720 | $8,800 | $91,920 |
| 2024 | $3,700 | $103,880 | $8,800 | $95,080 |
| 2023 | $3,689 | $102,160 | $8,800 | $93,360 |
| 2022 | $2,972 | $84,760 | $8,800 | $75,960 |
| 2021 | $2,297 | $67,200 | $8,800 | $58,400 |
| 2020 | $2,046 | $60,214 | $8,800 | $51,414 |
| 2019 | $1,723 | $51,496 | $8,800 | $42,696 |
| 2018 | $1,477 | $45,444 | $8,800 | $36,644 |
| 2017 | $1,218 | $39,004 | $8,800 | $30,204 |
| 2016 | $848 | $29,895 | $8,800 | $21,095 |
| 2015 | $746 | $0 | $0 | $0 |
| 2014 | $734 | $27,480 | $9,600 | $17,880 |
Source: Public Records
Map
Nearby Homes
- 5914 Waggoner Ct
- 5806 Waggoner Ct
- 5954 Rex Ridge Ct
- 5953 Farmbrook Ln Unit 1
- 5781 Creekside Dr
- 5798 Creekside Dr Unit 4
- 3548 Meadowview Ct
- 5652 Laney Dr
- 5640 Laney Dr
- 5952 Meadow Ln
- 5602 Swanson Rd
- 3099 Chippewa Dr
- 5861 Colonnade Dr
- 6103 Chaseland Dr
- 6103 Chaseland Rd
- 3668 Paddington Trail
- 5838 Highway 42
- 5502 Amelia Ln
- 3684 Paddington Trail
- 3645 Fay Dr Unit 1
- 3321 Waggoner Place
- 5997 Waggoner Ct
- 5997 Waggoner Ct Unit /172
- 6003 Waggoner Ct
- 5991 Waggoner Ct
- 3327 Waggoner Place
- 3320 Waggoner Way
- 3316 Waggoner Place
- 3322 Waggoner Place
- 3310 Waggoner Place
- 5985 Waggoner Ct
- 3326 Waggoner Way
- 3328 Waggoner Place
- 3333 Waggoner Place
- 3304 Waggoner Place
- 3332 Waggoner Way
- 3334 Waggoner Place
- 3317 Waggoner Trail
- 3339 Waggoner Place
- 3323 Waggoner Trail
Your Personal Tour Guide
Ask me questions while you tour the home.