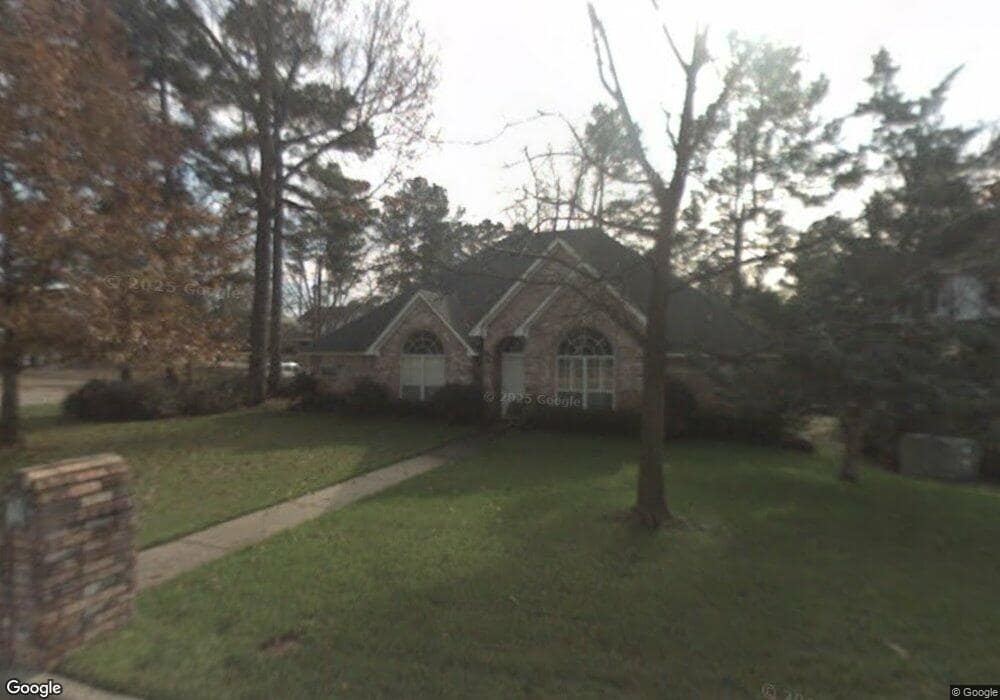
3315 Williamsburg Cir Texarkana, TX 75503
Estimated Value: $313,489 - $390,000
--
Bed
--
Bath
2,420
Sq Ft
$146/Sq Ft
Est. Value
About This Home
This home is located at 3315 Williamsburg Cir, Texarkana, TX 75503 and is currently estimated at $352,122, approximately $145 per square foot. 3315 Williamsburg Cir is a home located in Bowie County with nearby schools including Margaret Fischer Davis Elementary School, Pleasant Grove Intermediate School, and Pleasant Grove Middle School.
Ownership History
Date
Name
Owned For
Owner Type
Purchase Details
Closed on
Jan 29, 2018
Sold by
The 2010 Melba E Horn Trust
Bought by
Sarine Scott Ross and Sarine Emily Dicken
Current Estimated Value
Home Financials for this Owner
Home Financials are based on the most recent Mortgage that was taken out on this home.
Original Mortgage
$153,750
Outstanding Balance
$86,416
Interest Rate
3.93%
Mortgage Type
New Conventional
Estimated Equity
$265,706
Purchase Details
Closed on
Nov 19, 2012
Sold by
Horn Melba E
Bought by
Horn Melba E
Purchase Details
Closed on
Nov 7, 2012
Sold by
Horn Malba E
Bought by
Horn Melba E
Purchase Details
Closed on
Nov 6, 2012
Sold by
Horn Melba E
Bought by
Horn Melba E and Horn Dana B
Purchase Details
Closed on
Apr 18, 2005
Sold by
D & M Enterprises Lp
Bought by
Horn Dana B and Horn Melba E
Create a Home Valuation Report for This Property
The Home Valuation Report is an in-depth analysis detailing your home's value as well as a comparison with similar homes in the area
Home Values in the Area
Average Home Value in this Area
Purchase History
| Date | Buyer | Sale Price | Title Company |
|---|---|---|---|
| Sarine Scott Ross | -- | Stewart Title | |
| Horn Melba E | -- | None Available | |
| Horn Melba E | -- | None Available | |
| Horn Melba E | -- | None Available | |
| Horn Dana B | -- | None Available |
Source: Public Records
Mortgage History
| Date | Status | Borrower | Loan Amount |
|---|---|---|---|
| Open | Sarine Scott Ross | $153,750 |
Source: Public Records
Tax History Compared to Growth
Tax History
| Year | Tax Paid | Tax Assessment Tax Assessment Total Assessment is a certain percentage of the fair market value that is determined by local assessors to be the total taxable value of land and additions on the property. | Land | Improvement |
|---|---|---|---|---|
| 2025 | $5,564 | $313,939 | $30,000 | $283,939 |
| 2024 | $5,564 | $309,031 | $30,000 | $282,905 |
| 2023 | $6,325 | $280,937 | $0 | $0 |
| 2022 | $6,271 | $269,565 | $30,000 | $239,565 |
| 2021 | $6,072 | $232,179 | $30,000 | $202,179 |
| 2020 | $5,857 | $222,789 | $30,000 | $192,789 |
| 2019 | $5,768 | $213,835 | $30,000 | $183,835 |
| 2018 | $5,377 | $200,463 | $30,000 | $170,463 |
| 2017 | $5,276 | $197,218 | $30,000 | $167,218 |
| 2016 | $5,276 | $197,218 | $30,000 | $167,218 |
| 2015 | $5,305 | $198,943 | $30,000 | $168,943 |
| 2014 | $5,305 | $197,348 | $30,000 | $167,348 |
Source: Public Records
Map
Nearby Homes
- 3407 Williamsburg Ln
- 3409 Williamsburg Ln
- 3703 Maplecrest St
- 3707 Maplecrest St
- 3501 Clear Creek Cir
- 3 Spring Cove
- 604 Clear Creek Dr
- 6005 Stoneridge Dr
- 6010 Shadyside Ln
- 5917 Sidney Dr
- 5904 Cooks Ln
- 6301 Pecan Cove
- 3108 Bethany Ln
- 3104 Bethany Ln
- 3105 Bethany Ln
- 5812 Cooks Ln
- 5810 Cooks Ln
- 5808 Cooks Ln
- 4 Holly Ridge Dr
- 6107 Ben Burrough Rd
- 3317 Williamsburg Cir
- 3309 Williamsburg Ln
- 3308 Williamsburg Ln
- 3321 Williamsburg Cir
- 3307 3307 Williamsburg Ln
- 3402 Williamsburg Ln
- 3307 Williamsburg Ln
- 3306 Williamsburg Ln
- 3401 Williamsburg Ln
- 3602 Wyatt Ln
- 3305 Williamsburg Ln
- 3319 Williamsburg Cir
- 3404 Williamsburg Ln
- 3406 Wyatt Ln
- 3403 Williamsburg Ln
- 3402 Wyatt Ln
- 3303 Williamsburg Ln
- 3406 Williamsburg Ln
- 5 Valleyview Cir
- 3405 Williamsburg Ln