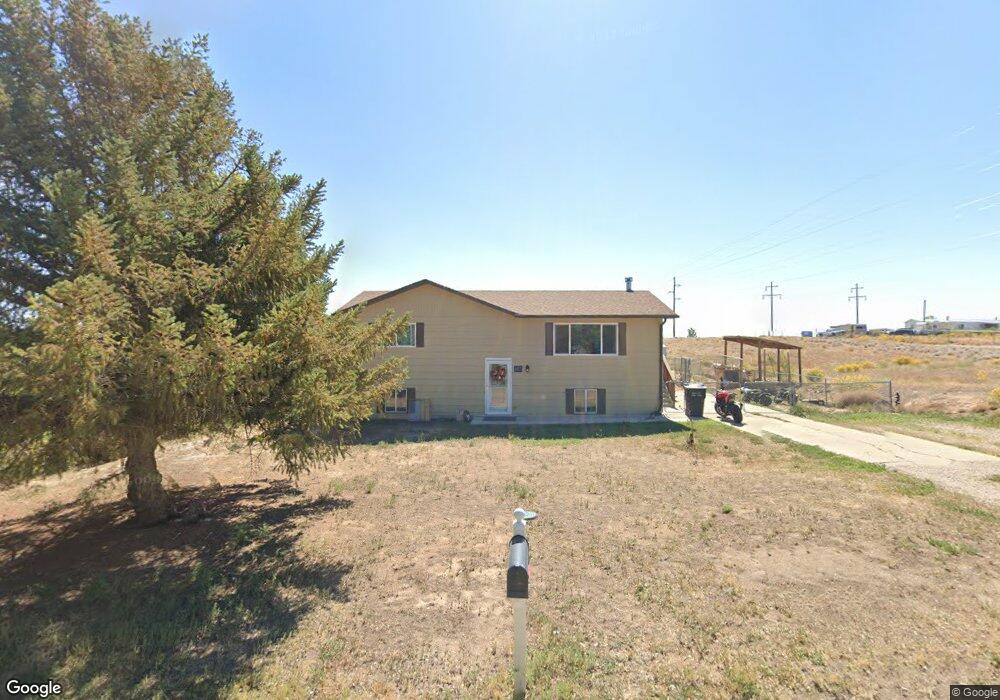
3316 E 5000 S Vernal, UT 84078
Estimated Value: $346,000 - $364,000
4
Beds
1
Bath
1,920
Sq Ft
$187/Sq Ft
Est. Value
About This Home
This home is located at 3316 E 5000 S, Vernal, UT 84078 and is currently estimated at $358,182, approximately $186 per square foot. 3316 E 5000 S is a home located in Uintah County with nearby schools including Davis School, Vernal Middle School, and Uintah Middle School.
Ownership History
Date
Name
Owned For
Owner Type
Purchase Details
Closed on
Aug 26, 2024
Sold by
Martinez Ramona Kay
Bought by
Olsen Carston and Olsen Gentri
Current Estimated Value
Home Financials for this Owner
Home Financials are based on the most recent Mortgage that was taken out on this home.
Original Mortgage
$332,767
Outstanding Balance
$327,376
Interest Rate
6.77%
Mortgage Type
New Conventional
Estimated Equity
$30,806
Purchase Details
Closed on
Aug 8, 2022
Sold by
David Lacy
Bought by
Martinez Ramona Kay
Purchase Details
Closed on
Sep 24, 2010
Sold by
Hedrick Trina N
Bought by
Hedrick Trina N
Home Financials for this Owner
Home Financials are based on the most recent Mortgage that was taken out on this home.
Original Mortgage
$139,509
Interest Rate
4.5%
Mortgage Type
FHA
Purchase Details
Closed on
Jun 29, 2006
Sold by
Winn Kenneth E and Winn Terri L
Bought by
Henrick Trina N
Home Financials for this Owner
Home Financials are based on the most recent Mortgage that was taken out on this home.
Original Mortgage
$144,236
Interest Rate
6.63%
Mortgage Type
FHA
Create a Home Valuation Report for This Property
The Home Valuation Report is an in-depth analysis detailing your home's value as well as a comparison with similar homes in the area
Purchase History
| Date | Buyer | Sale Price | Title Company |
|---|---|---|---|
| Olsen Carston | -- | Farm And Home Title | |
| Martinez Ramona Kay | -- | Basin Land Title | |
| Hedrick Trina N | -- | -- | |
| Henrick Trina N | -- | -- |
Source: Public Records
Mortgage History
| Date | Status | Borrower | Loan Amount |
|---|---|---|---|
| Open | Olsen Carston | $332,767 | |
| Previous Owner | Hedrick Trina N | $139,509 | |
| Previous Owner | Henrick Trina N | $144,236 |
Source: Public Records
Tax History
| Year | Tax Paid | Tax Assessment Tax Assessment Total Assessment is a certain percentage of the fair market value that is determined by local assessors to be the total taxable value of land and additions on the property. | Land | Improvement |
|---|---|---|---|---|
| 2024 | $1,607 | $184,897 | $20,170 | $164,727 |
| 2023 | $1,554 | $149,876 | $20,170 | $129,706 |
| 2022 | $1,123 | $108,874 | $20,170 | $88,704 |
| 2021 | $1,183 | $51,750 | $11,094 | $40,656 |
| 2020 | $996 | $81,368 | $15,850 | $65,518 |
| 2019 | $834 | $67,347 | $15,850 | $51,497 |
| 2018 | $803 | $64,895 | $15,850 | $49,045 |
| 2017 | $8 | $64,895 | $15,850 | $49,045 |
| 2016 | $812 | $72,029 | $15,850 | $56,179 |
| 2015 | $770 | $74,216 | $15,802 | $58,414 |
| 2014 | $733 | $71,435 | $15,802 | $55,633 |
| 2013 | $749 | $71,435 | $15,802 | $55,633 |
Source: Public Records
Map
Nearby Homes
- 3340 E 5000 S
- 3447 E 5300 S
- 3998 E 5000 S
- 4977 S 2625 E
- 3541 U S Highway 40
- 4361 S 2280 E
- 2658 E 3950 S
- 3955 4000 East St
- 2636 E 3950 S
- 4111 E 4000 S
- 3311 E 3500 S Unit 3
- 3331 E 3500 S Unit 4
- 2101 E Goose Ranch Rd
- 1801 E 4500 S
- 5600 S 1500 E
- 1676 E 4000 S
- 2308 E Highway 40
- 3310 S 2500 E
- 3203 S 4000 E
- 1435 E 5975 S Unit 14
Your Personal Tour Guide
Ask me questions while you tour the home.